


CHP. 17 USING SPECTRUM ANALYSIS
251
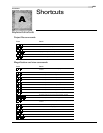
Using a sonogram
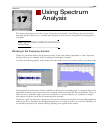
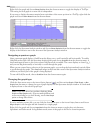
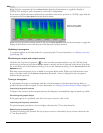
The sonogram is another way of displaying spectral data variations over time. In a sonogram, the horizontal
axis represents time, and the vertical axis represents frequency.
The amplitude of each frequency component in the sonogram
is represented by the color intensity of each
point in the graph. This method of displaying spectral information is useful for identifying distinctive
spectral patterns created from sounds such as speech, musical instruments, and ambient noise.
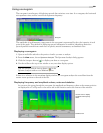
Displaying a sonogram
1.
Open an audio file and select the portion of audio you want to analyze.
2.
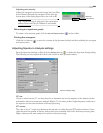
From the View menu, choose Spectrum Analysis. The Spectrum Analysis dialog appears.
3.
Click the Sonogram button ( ) to display your data as a sonogram.
4.
Use the toolbar at the top of the window to set your other display options.
Tip:
You can also click the Settings button () in the
Spectrum Analysis window to set additional options.
If there is no selection in the waveform display window, the sonogram analyzes the sound data from the
current cursor position to the end of the file.
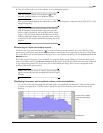
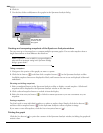
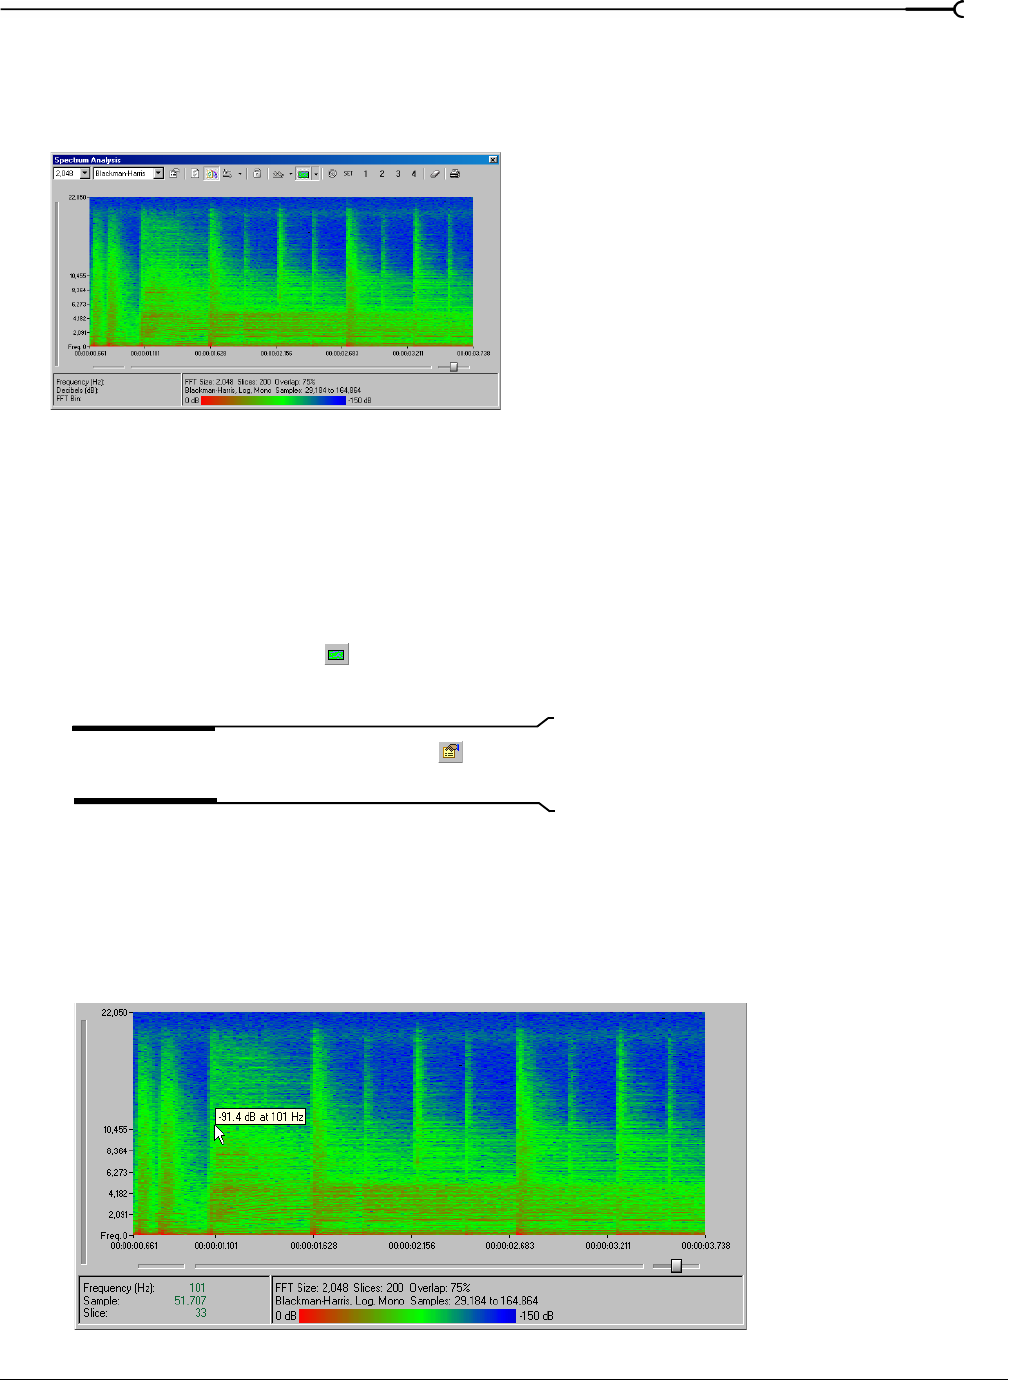
Displaying frequency and amplitude values, notes and statistics
As you move the cursor through the sonogram, the amplitude and frequency values at the current position
are displayed in a ToolTip next to the cursor and in the Statistics area at the bottom of the window:
Sonogram
Use the cursor to display
amplitude and frequency
values
Statistics area