


17
CHP. 17 USING SPECTRUM ANALYSIS
CHAPTER
245
Using Spectrum
Analysis
This chapter introduces you to the concept of frequency and describes Sound Forge’s Spectrum Analysis.
Spectrum Analysis allows you to examine audio frequencies and overtones using either spectrum graphs or
sonograms.
Note:
Spectrum Analysis is available only in the full version
of Sound Forge.
Working in the frequency domain
Unlike the waveform display, which represents audio in the time domain (amplitude vs. time), Spectrum
Analysis allows you to examine audio recordings in the frequency domain.
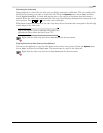
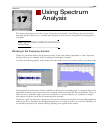
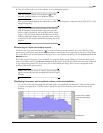
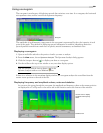
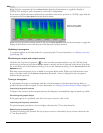
Consider the following graphic, which depicts the same audio event as a waveform and as a spectrum graph.
Data displayed in the frequency domain (whether in the form of a spectrum graph or sonogram) depicts the
amplitudes and frequencies of sine waves that, if mixed, would sound much like the original audio. Since it is
relatively easy to remember what a sine wave sounds like at a specific frequency, it is possible to imagine
what simple waveforms sound like by examining their spectrum.
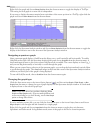
Learning to “read” the frequency components of a sound in conjunction with their corresponding amplitudes
makes it possible to determine the fundamental frequency of a sound, as well as its overtones. Similarly, you
can identify unwanted noise, thereby allowing filtering to be applied where needed.
Spectrum graphWaveform display
17