CHP. 17 USING SPECTRUM ANALYSIS
247
4.
Use the toolbar at the top of the window to set your display options.
Tip:
You can also click the Settings button () in the
Spectrum Analysis window to set additional options.
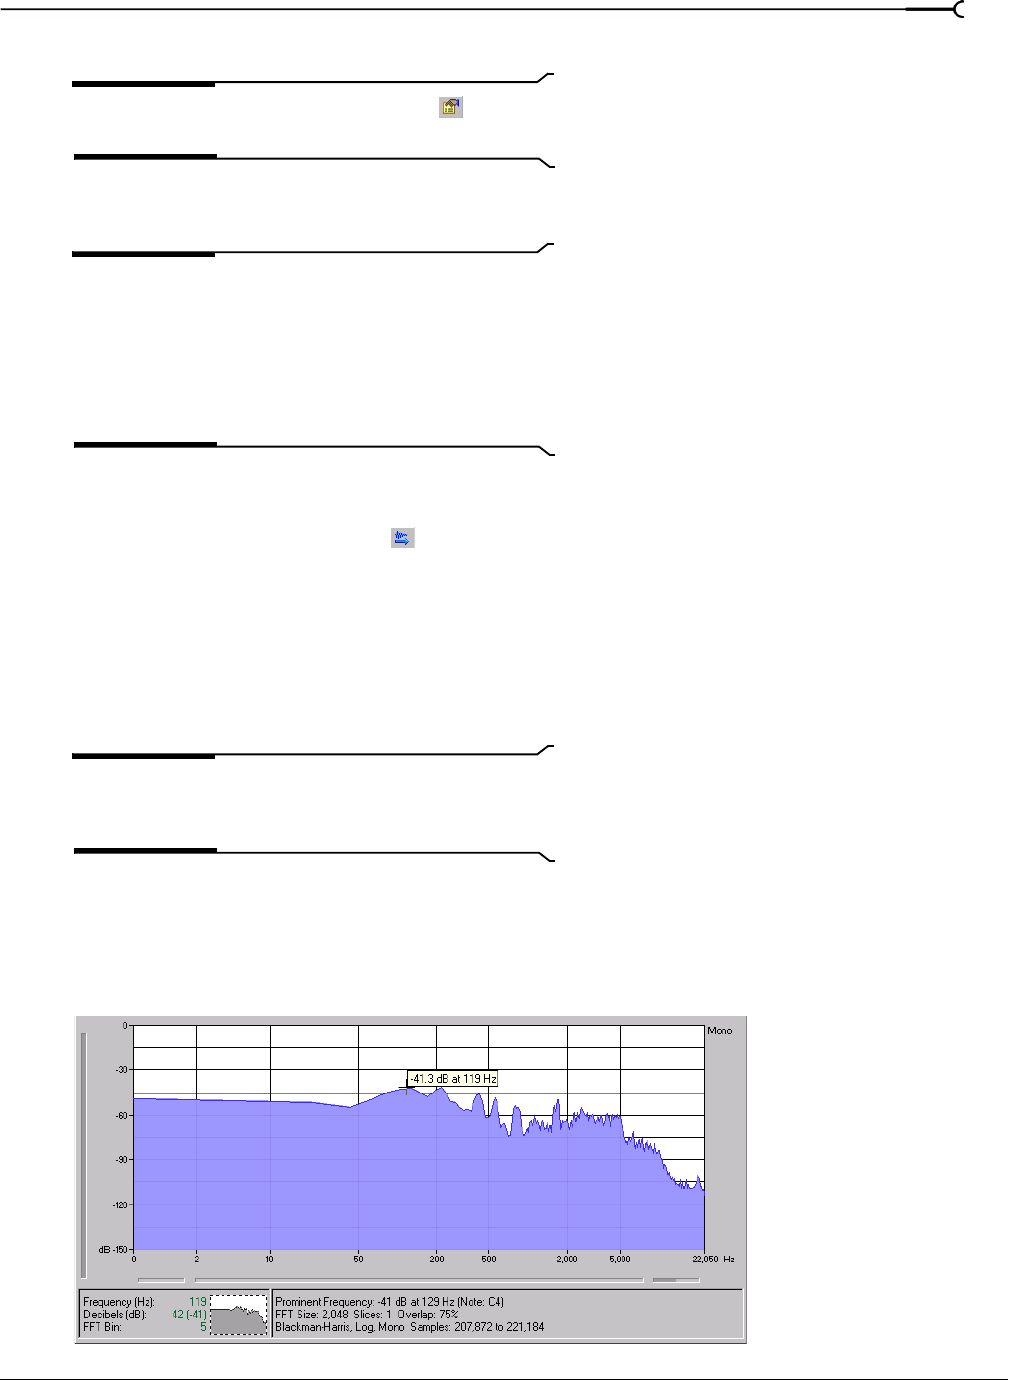
The spectrum graph displays the amplitude (in dB) of each frequency component from 0 Hz (DC) to the
Nyquist frequency.
Tip:
You can continue to make selections in the audio file
with the Spectrum Analysis window open (just move the
cursor or make selections as you normally would in Sound
Forge). Click the
Refresh button in the Spectrum Analysis
toolbar to update the display. If no selection is made, analysis
is performed on the samples immediately following the cursor
position.
Monitoring an input and output source
Click the Real Time Monitoring button ( ) to turn real-time spectrum analysis on or off. Click the down
arrow next to the button and choose
Monitor: Input to monitor the device selected in the Record drop-down
list on the Wave tab of the Preferences dialog (to access the Preferences dialog, choose
Preferences from the
Options menu).
Real-time output monitoring is not available in sonogram display mode. When you click the down arrow
next to the button and choose
Monitor: Output from the menu, Sound Forge will monitor the device selected
in the
Playback drop-down list on the Wave tab of the Preferences dialog, and a cursor is displayed in the
graph to indicate the play position.
Note:
When Monitor: Output is selected, the post-processing
signal is monitored when you start playback from the Plug-In
Chainer.
Displaying frequency and amplitude values, notes and statistics
As you move the cursor through the spectrum graph, the amplitude and frequency values at the current
position are displayed in a ToolTip next to the cursor and in the Statistics area at the bottom of the
window:
Use the cursor to display
amplitude and frequency
values
Statistics area


