250
USING SPECTRUM ANALYSIS CHP. 17
6.
Click OK.
7.
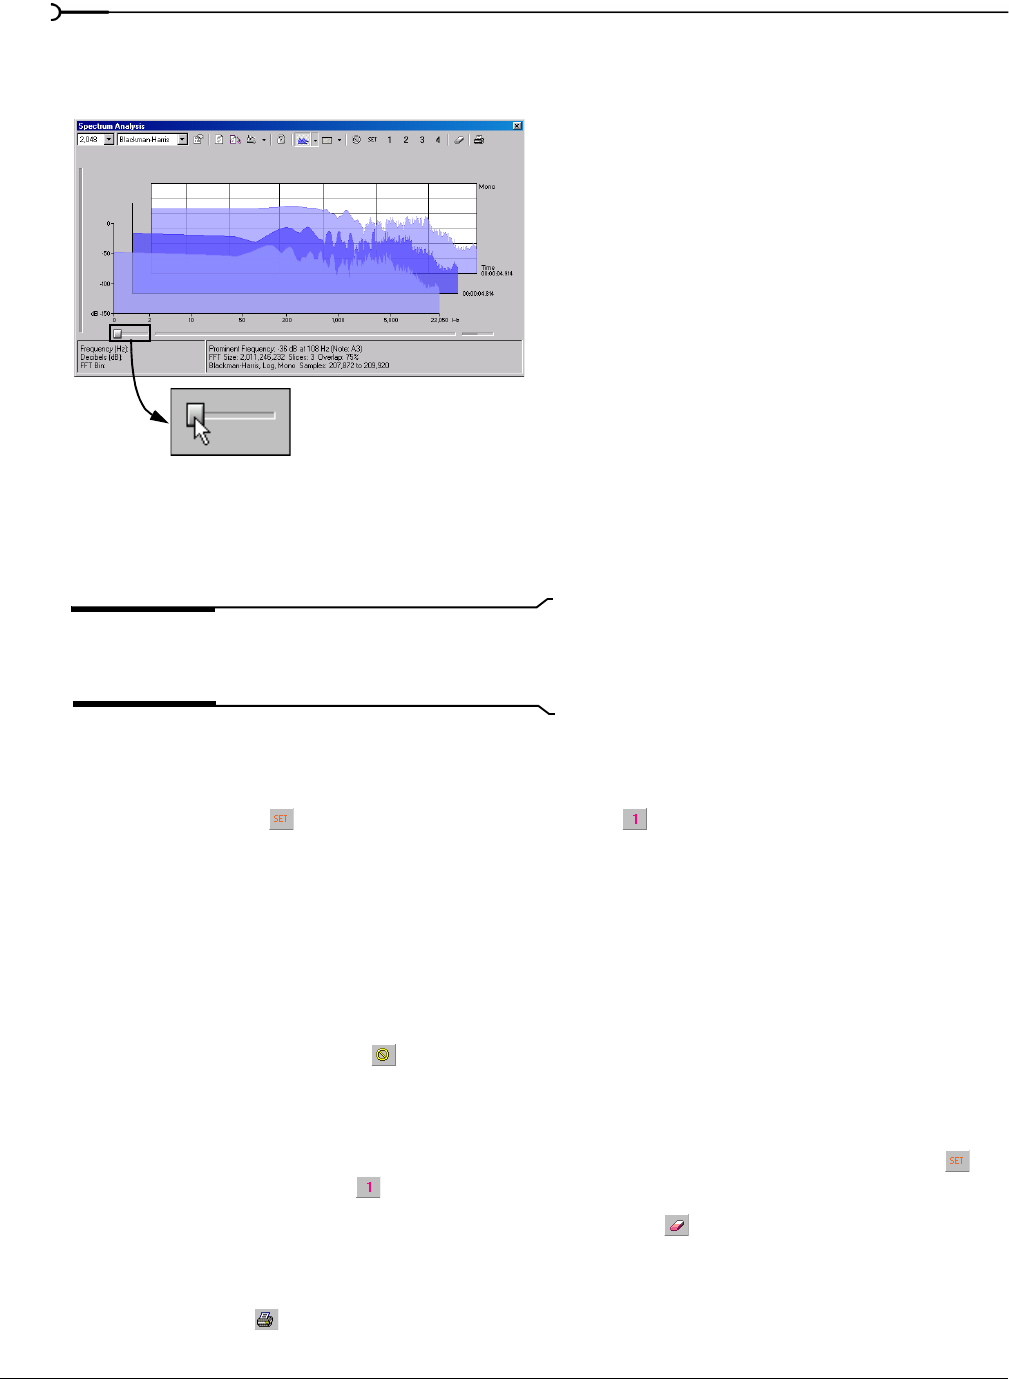
Use the Slice slider to add/remove slice graphs in the Spectrum Analysis dialog.
Creating and comparing snapshots of the Spectrum Analysis window
You can store up to four snapshots to compare multiple spectrum graphs. You can take snapshots from a
single data window or from different data windows.
Note:
Snapshots are not available in sonogram display or
when the
Slices displayed setting in the Spectrum Settings
dialog is greater than 1.
Taking a snapshot
1.
Navigate to the portion of the graph you want to capture.
2.
Click the Set button ( ), and then click a snapshot button ( ) in the Spectrum Analysis toolbar.
Available snapshots buttons are displayed in black, and buttons that are in use are displayed in blue and
underlined.
Showing and hiding snapshots
1.
Select a numbered button in the Spectrum Analysis toolbar to display a stored snapshot. All selected
snapshots will be displayed in the Spectrum Analysis window at the same time.
2.
Click a selected snapshot button to exclude it from the display.
3.
Select the Hide active plot button ( ) to hide the current spectrum so you can concentrate on your
snapshots.
Erasing snapshots
You don't need to erase individual snapshots to update or replace them. Simply click the Set button ( ),
and then click a snapshot button ( ) in the Spectrum Analysis toolbar to update its image.
If you want to erase all snapshots, click the
Clear all snapshots button ( ).
Printing the graph
Click the Print button ( ) to print the contents of the Spectrum Analysis window, including the graph and
statistics data.
Use the Slice slider
to add or remove
slice graphs


