


Section 4-5
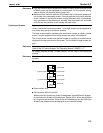
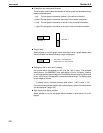
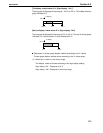
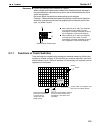
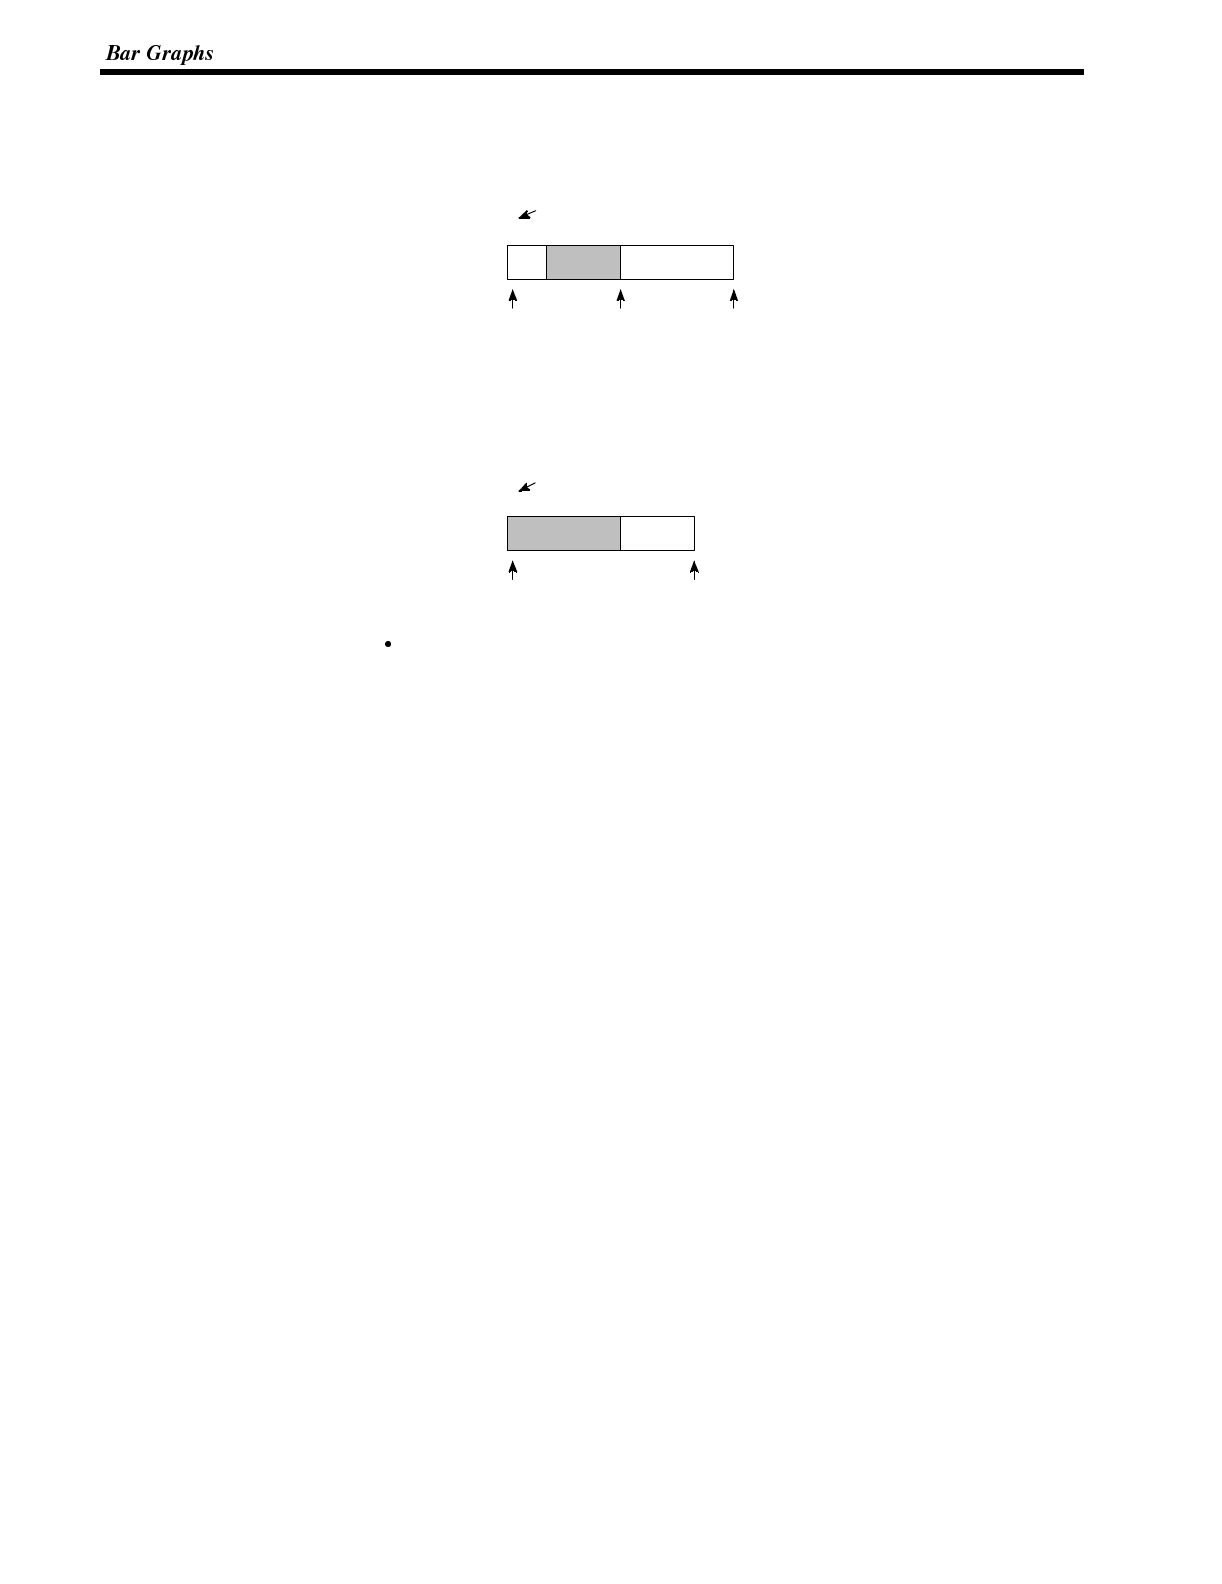
[To display a value below 0 %: Sign display “Yes”]
The bar graph is displayed in the range of --100 % to 100 %. The middle of the bar
graph indicates 0 %.
% display
0 % 100 %--100 %
--60 %
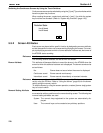
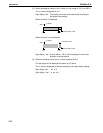
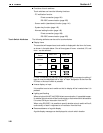
[Not to display a value below 0 %: Sign display “No”]
The bar graph is displayed in the range of 0 % to 100 %. The end of the bar graph
indicates 0 %. Values below 0 % are indicated as 0 %.
% display
0 % 100 %
60 %
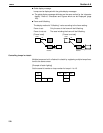
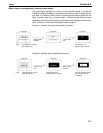
Differences in the bar graph display method according to the % values
The bar graph display method varies according to the % value range.
(1) When the % value is in the minus range
The display varies as follows according to the sign display setting:
Sign display “No”: Displayed as 0 %.
Sign display “Yes”: Displayed in the minus range.