WEBVISION™
11 95-7769—01
trends stored in WebVision. You cannot delete these sample
trends. However, you can create new trends. The trends
created by you are called User Defined trends.
When you add a device, all the default trends present in that
device are added to WebVision. All the default trends are
disabled.
You can create and view a maximum of 100 trends.
To view trends:
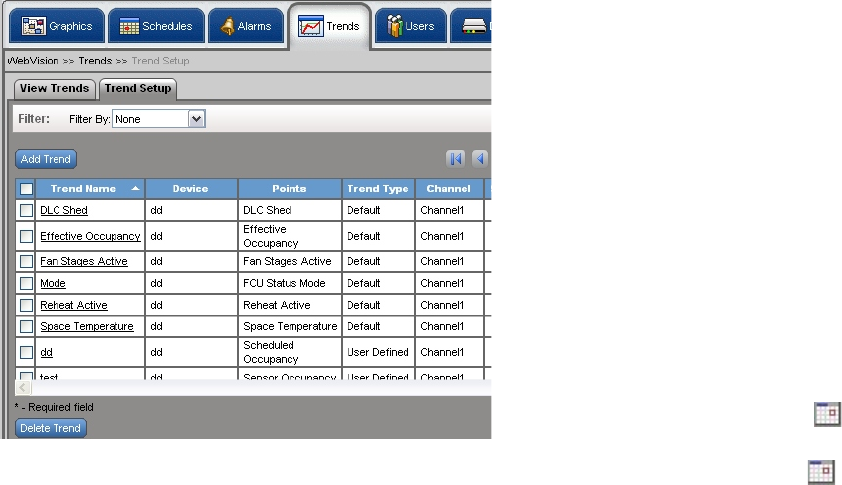
Click the Trends tab. The View Trends page appears with the
following information:
Fig. 19. Trends page.
— Trend Name – The unique name for the Trend.
— Device – Indicates the location on the device.
— Points – Indicates the points whose readings are
required to generate a trend.
— Trend Type – Indicates type of trend. For instance it
can be a user defined trend.
— Channel – Indicates the channel on which the devices
are present.
— Sampling Interval – Indicates the time interval
between two successive read operations on the point.
One hour is the default setting.
The sampling interval time can range from a few
minutes to a day. The range covered is:
• 15 seconds
• 30 seconds
• 60 seconds (1 minute)
• 900 seconds (15 minutes)
• 1800 seconds (30 minutes)
• 2700 seconds (45 minutes)
• 3600 seconds (60 minutes)
— Enable/Disable – Indicates if a trend is enabled or
disabled. Click the Enable or Disable buttons to
enable/disable the trend.
TIP: Use Filters to quickly search the required trend.
Use one of the following filter options to search for the
required trend:
• Channel Name
• Trend Type
• Trend Name
• Device Name
•Point Name
• Point Group
TIP: To quickly search the trends, type the first letter of the
required filter criteria in the Keyword text box and type
an asterisk (*). This lists all the names starting with the
first letter that you have written in the Keyword text box.
Plotting trends
NOTES:
1. A security warning message appears when you
access the Trends page and prompts you to
download the applet. Click Yes to continue.
2. A Java plug-in version 1.6 and above must be
installed to view the trend chart.
To plot a trend:
1. Click the Trends tab. The View Trends page appears.
2. Select a trend from the Configured Trends list to plot.
3. Click Plot Trend. The Plot Trend dialog box appears.
4. Enter the following parameters:
•Select Start Time – Click to select the start
date and enter the start time in hours and minutes.
•Select End Time – Click to select the end date
and enter the end time in hours and minutes.
NOTE: Start time must be less than the end time.
5. Click OK to view the graphical representation of the
trend or click Cancel to cancel the trend.
Viewing plotted trends
The view of the trends plotted have the following information:
• Plotted Trends – Lists the name of the trends that are
plotted.
• Start Time – Select the start time, if required.
• End Time – Select the end time, if required.
• Re-Plot Trends – After selecting the Start and End time
select this option to re-plot the trend with the new time
range.
• Download Trendlog – Click this button to download trend
log in .csv format for the plotted trends.
• Ok – Click Ok to go back to the View Trends screen.


