


290 Collecting logs and viewing Excel reports
Section 7: Maintenance and troubleshooting Reference, Installation, and Operations Manual
June 2013 3-9000-743 Rev S
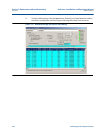
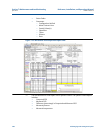
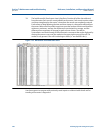
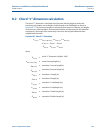
19. The last Microsoft® Excel report view is Raw Data. Contains all of the data collected
from the meter. Each row is a record polled from the meter. Each record contains a date
and time stamp based on the meter’s time when the record was completely received.
Each column of data following the date and time stamps is a data point collected from
the meter. Below all of the polled records are rows that analyze the data and detail the
minimum, maximum, average, the difference from minimum to average, and the
difference from maximum to average for each column of data. The cells for
SystemStatus and StatA through StatD will contain a comment that can be displayed by
moving the mouse cursor over the marker in the upper-right corner of the cell. The
marker is only present if the cell is indicating an alarm (i.e. non 0x0000 value).
Figure 7-25 Microsoft® Excel Raw Data View
Use these reports to compare with previously saved reports as a Meter Health check and for
trending of the meter’s diagnostics.