


286 Collecting logs and viewing Excel reports
Section 7: Maintenance and troubleshooting Reference, Installation, and Operations Manual
June 2013 3-9000-743 Rev S
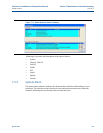
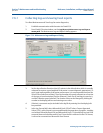
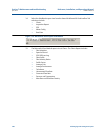
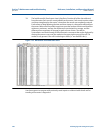
14. Select the Workbook report view from the lower left Microsoft® Excel toolbar. Tab
selections include:
• Charts
• Inspection Report
• SOS
• Meter Config
• Raw Data
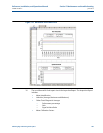
Figure 7-20 Microsoft® Excel report view toolbar
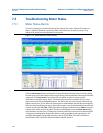
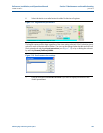
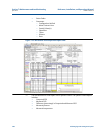
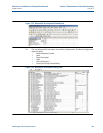
15. The Microsoft® Excel default report view is Charts. The Charts Report includes:
• Flow Velocities
• Speed of Sound
• SOS Diff from Avg
• Flow Profile
• Flow Velocity Ratios
• Profile Factor
• Average Gain
• Average Performance
• Turbulence
• Uncorrected Flow Rate
• Corrected Flow Rate
• Pressure and Temperature
• Mass Rate and Flow Mass Density