


HELIX DN9848E Remote Control Software
User Guide
53
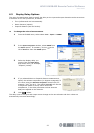
5.4 Monitoring the Output Signals
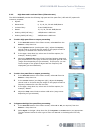
5.4.1 Meters - peak
Each of the eight outputs has an 11-segment signal meter for monitoring internal signal clipping and
output levels that may cause damage to the loudspeaker equipment.
The top segment (illuminated in diagram left) monitors the internal signal clipping. It
operates independently of the rest of the meter, illuminating if signal clipping is detected at
any stage in the processing circuits regardless of whether the level of the final processed
signal is above or below the compressor and/or limiter thresholds. Hence, the audio engineer
has full visibility of any internal signal clipping that may result in audio distortion.
The 0 to –40 dBu signal meter is primarily designed to monitor the output level with respect
to excessive levels that may cause damage to the onward loudspeaker equipment.
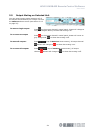
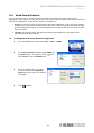
5.4.2 Meters – gain reduction
Both the Compressor and Limiter panels of the Dyn. screen show the gain reduction using a 10-segment
meter.
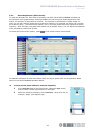
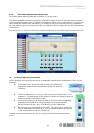
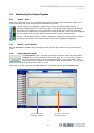
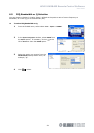
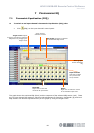
5.4.3 Output Response graph
The Output Response graph– accessed by pressing the button shown left on the HELIX
DN9848E Units Home screen (see section 3.4.3 page 25) - lets you view a graph of
the output channels’ PEQ, filter and dynamics settings, in any combination. Each
output channel on the graph is colour-coded for ease of identification. The tick boxes
allow you to switch the graph of each output on or off.
Additionally, you can select filter and PEQ options for the selected outputs in the Filter Sections box.
Tick to determine
displayed channels
Choose to view both or
individual graphs