


YORK INTERNATIONAL38
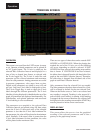
OVERVIEW
This screen is accessed from the UNIT screen. As many
as six Operator selected parameters can be plotted in
an X/Y graph format. The X-Axis is scaled per the
selected Data Collection Interval and displayed in a
time of day or elapsed time format, as selected with
the X-axis toggle key. The Y-Axis is scaled for each
parameter per the selected minimum and maximum
value for each parameter. Analog parameters are scaled
in pressure, temperature, volts, amps, hertz or time.
Digital on/off parameters are scaled as zero (off) and
one (on). Only one Y-Axis label is displayed at a time.
The Y-Axis Toggle Key is used to toggle the Y-Axis
labels through the different parameters. The Y-Axis
label that is being displayed is identied at the top of the
graph. All parameters are displayed simultaneously. For
identication, each plotted parameter and associated
Y-Axis labeling is color coordinated.
The parameters are sampled at the selected Data
Collection Interval and plotted using 450 data points
across the X-Axis. If the actual value of the sampled
parameter is less than the Y-Axis label minimum for
that parameter, the value will be plotted at the minimum
value. Similarly, if the actual value is greater than the
Y-Axis label maximum for that parameter, the value
will be plotted at the maximum value.
There are two types of charts that can be created: ONE
SCREEN or CONTINUOUS. When the plotting has
reached the end of the X-Axis, one of the following
will occur, depending on which is selected: If ONE
SCREEN has been selected, the trending stops and the
data is frozen. If CONTINUOUS has been selected,
the oldest data is dropped from the left-hand side of the
graph at the next Data Collection Interval. Thereafter,
the oldest data is dropped from left-hand side of the
graph at each Data Collection Interval.
Only parameters from the selected Unit are trended.
The same parameters that have been selected for a Unit,
will be selected by default for the next selected Unit.
When on the Home screen, a Unit is not selected and
any trending is stopped. Trending is also stopped if a
power failure occurs while it is running. After trending
is stopped, the last screen of data that was collected will
be displayed on the trending screen and the START key
must be pressed to initiate a new trend screen.
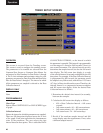
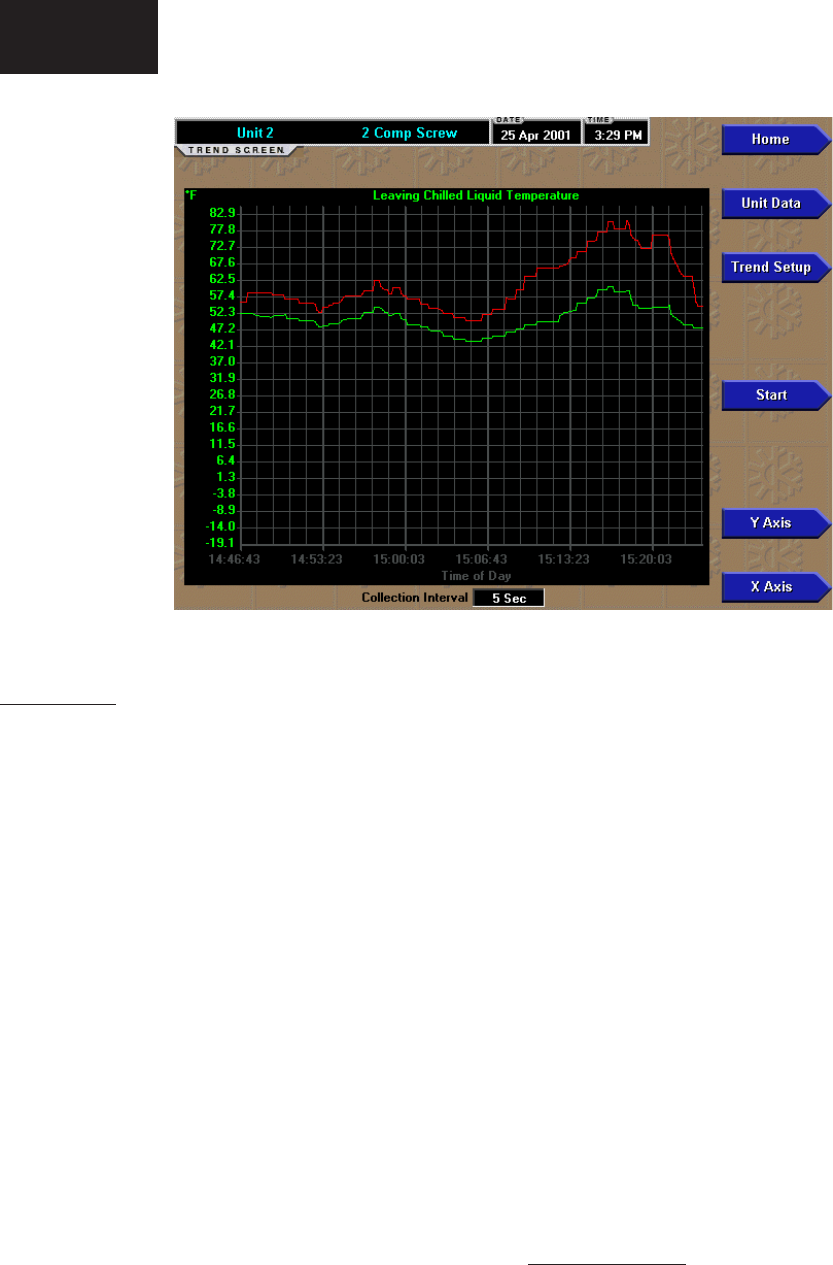
DISPLAY ONLY
This screen allows the user to view the graphical
trending of the selected parameters and is also a
gateway to the graph setup screens.
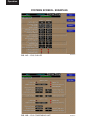
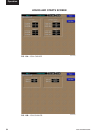
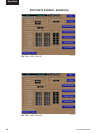
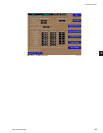
TRENDING SCREEN
FIG. 15 TRENDING
00574VIPC
Operation