


99
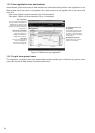
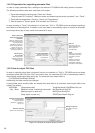
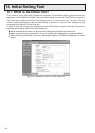
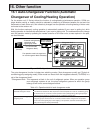
Trend graph button
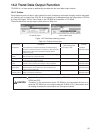
Trend data and peak
cut data are developed
to trend graphs.
Selection of trend data
Trend data and peak cut
data files are selected.
Display of a selected file
Selected trend data and
peak cut data files are
displayed on the screen.
D:¥TrendData¥2003¥07¥Temp2003-07-07B0003.csv
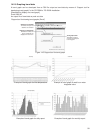
Figure 14-5 Support tool for trend graph
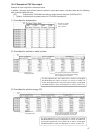
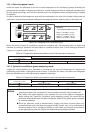
Example of trend graph for inlet temperature Example of trend graph for watt-hour meter
integrated value
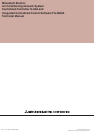
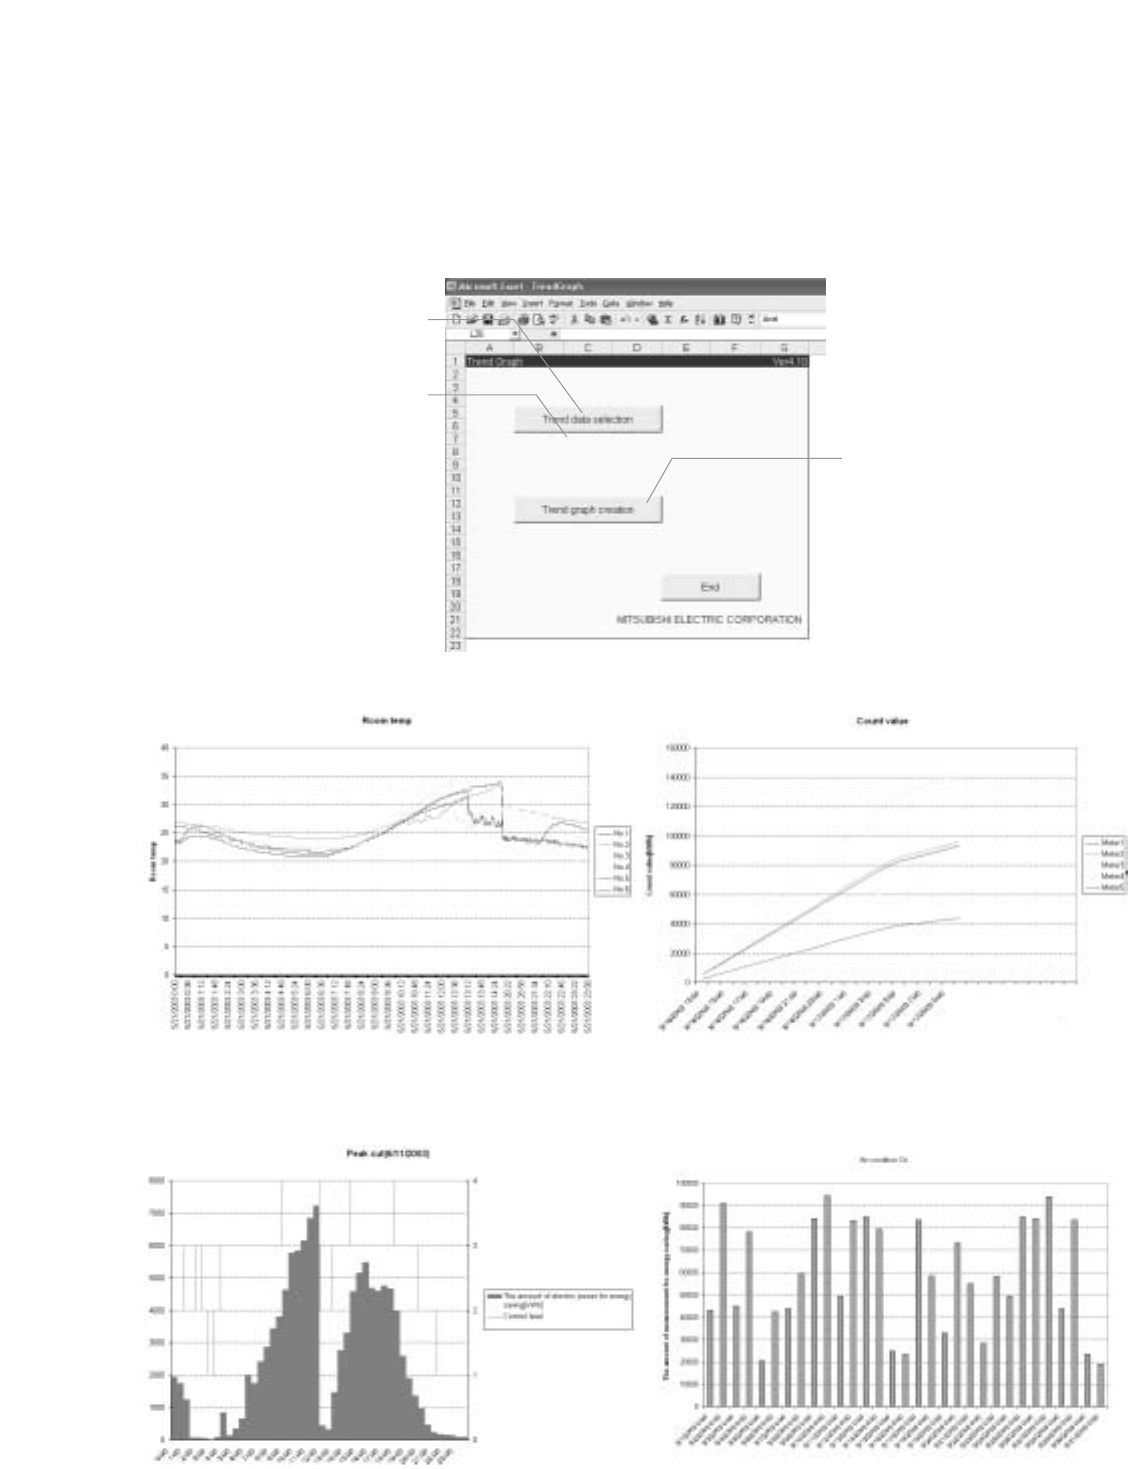
Example of trend graph for daily report Example of trend graph for monthly report
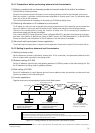
14.2.5 Graphing trend data
A trend graph can be developed from a CSV file output as trend data by means of “Support tool for
developing trend graphs” in the CD-ROM for TG-2000A installation.
[Essentials for display of a trend graph]
Excel 2000/XP
An output file of trend data or peak cut data
“Support tool for drawing trend graphs (Excel)”