


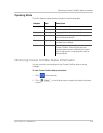
Monitoring System Components
975-0704-01-01 Revision A 4–11
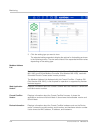
Graph Element Description
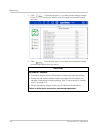
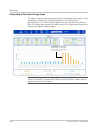
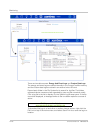
Aggregate Energy Information Displays total energy used by the system component. It accumulates
data on a daily, weekly, monthly, yearly, and lifetime basis.
• Daily aggregates information collected at the start of the day
(12:00AM), up to the most recently completed hour.
• Weekly aggregates data starting from the most recent Sunday
up to the most completed day to date.
• Monthly sums up all information for the current month from day
1 up to the most completed day to date.
• Yearly sums up all information for the current year from month 1
up to the most completed month to date.
• Lifetime aggregates all data collected from the very beginning
the system started.
Important: Energy aggregation is based on the data collected by
ComBox. Actual lifetime energy for each device may differ.
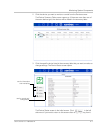
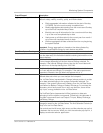
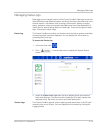
Real-Time System Readings Displays real-time information on the system component selected.
Data Area This is where the graph is presented. If you hover the mouse pointer
over the data area, an information bubble containing information on the
object displays.
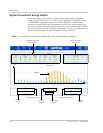
X-Axis The X-axis label generally represents time. The tick mark labels on the
X-axis change depending on the time Interval Setting selected. For
example, if the Interval Setting is Hours, then the tick mark labels will
be each hour of the day starting from 12:00 AM.
Y-Axis The Y-axis label is Energy in watt-hours (Wh). The tick mark labels on
the Y-axis adjusts accordingly. For example, if the watt measurement
expands to kilowatts, then the labels will appear with a “k”.
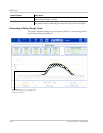
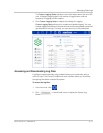
Data Series There are two data series. This means that you can display two
different data sets which you can analyze and compare.
The 1st Data Series (represented in Orange) always pertains to a data
set or data sets belonging to the system component selected. For
example, if the system component is Battery, then the 1st Data Series
could either be Battery Charge or Battery Discharge. For sources like
Generator, which have power flow in only one direction, there will be
only “input” energy viewable in the 1st Data Series.
The 2nd Data Series (represented in Blue) pertains to data sets
belonging to all the system components. Collectively, the data sets of
all system components are
Load Output, PV Input, Battery Discharge,
and Battery Charge.
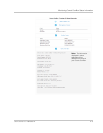
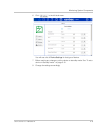
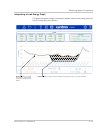
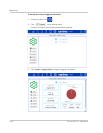
Calendar Controls There are two calendar controls. The 1st Calendar Controls (also in
Orange) is meant for the 1st Data Series. The 2nd Calendar Controls (in
Blue) is for the 2nd Data Series.
The controls are the left arrow, right arrow, and the calendar pop up link
in between the two arrows. When you click the calendar pop-up link, it
displays a calendar selector application.