


Monitoring
4–10 975-0704-01-01 Revision A
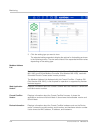
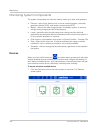
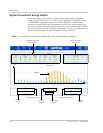
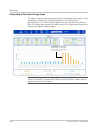
System Component Energy Graphs
Each of the system components, except Devices, generates an interactive
energy graph that allows you to monitor energy readings of the Battery, Loads,
and Generator. Aggregate energy information collected on a daily, weekly,
monthly, and yearly basis can be displayed for each of the components using
bar and line graphs. Using the graphs as an aid, you can analyze your system’s
performance and maximize its energy consumption. You can make decisions on
effective load management, and find areas for energy efficiency.
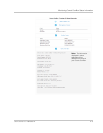
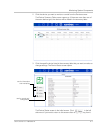
aggregate energy
information
real-time system
readings
Y-axis
X-axis
2nd data
series
1st data
series
interval
setting
1st calendar controls 2nd calendar controls
graph type
setting
data area
objects
Note: For a description of each graph element refer to the following table on page 4–11.