


14-7
Cisco ONS 15454 Reference Manual, R8.5.x
78-18106-01
Chapter 14 Alarm Monitoring and Management
14.3.7 Viewing History
14.3.6.3 Filtering Conditions
The condition display can be filtered to prevent display of conditions (including alarms) with certain
severities or that occurred between certain dates. You can set the filtering parameters by clicking the
Filter button at the bottom-left of the Conditions window. You can turn the filter on or off by clicking
the Filter tool at the bottom-right of the window. CTC retains your filter activation setting. For example,
if you turn the filter on and then log out, CTC keeps the filter active the next time your user ID is
activated.
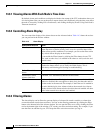
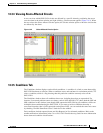
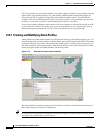
14.3.7 Viewing History
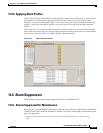
The History window displays historic alarm or condition data for the node or for your login session. You
can choose to display only alarm history, only events, or both by checking check boxes in the History >
Shelf window. You can view network-level alarm and condition history, such as for circuits, for all the
nodes visible in network view. At the node level, you can see all port (facility), card, STS, and
system-level history entries for that node. For example, protection-switching events or
performance-monitoring threshold crossings appear here. If you double-click a card, you can view all
port, card, and STS alarm or condition history that directly affects the card.
Note In the Preference dialog General tab, the Maximum History Entries value only applies to the Session
window.
Different views of CTC display different kinds of history:
• The History > Session window is shown in network view, node view, and card view. It shows alarms
and conditions that occurred during the current user CTC session.
• The History > Shelf window is only shown in node view. It shows the alarms and conditions that
occurred on the node since CTC software was operated on the node.
• The History > Card window is only shown in card view. It shows the alarms and conditions that
occurred on the card since CTC software was installed on the node.
Tip Double-click an alarm in the History window to display the corresponding view. For example,
double-clicking a card alarm takes you to card view. In network view, double-clicking a node alarm takes
you to node view.
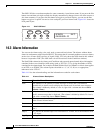
Path Width Width of the data path.
Sev
1
Severity level: CR (Critical), MJ (Major), MN (Minor), NA (Not Alarmed), NR
(Not Reported).
SA
1
Indicates a service-affecting alarm (when checked).
Cond The error message/alarm name; these names are alphabetically defined in the “Alarm
Troubleshooting” chapter of the Cisco ONS 15454 Troubleshooting Guide.
Description Description of the condition.
1. All alarms, their severities, and service-affecting statuses are also displayed in the Condition tab unless you choose to filter
the alarm from the display using the Filter button.
Table 14-5 Conditions Column Description (continued)
Column Information Recorded