


Theory of Operation Model GFC7000TA Carbon Dioxide Analyzer
Teledyne Analytical Instruments 214
includes, by default, the last 48 samples, approximately 10 seconds of data, to allow the analyzer to more
quickly respond. If necessary, these boxcar lengths can be changed between 1 and 1000 samples but
with corresponding tradeoffs in rise time and signal-to-noise ratio (contact customer service for more
information).
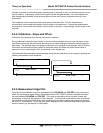
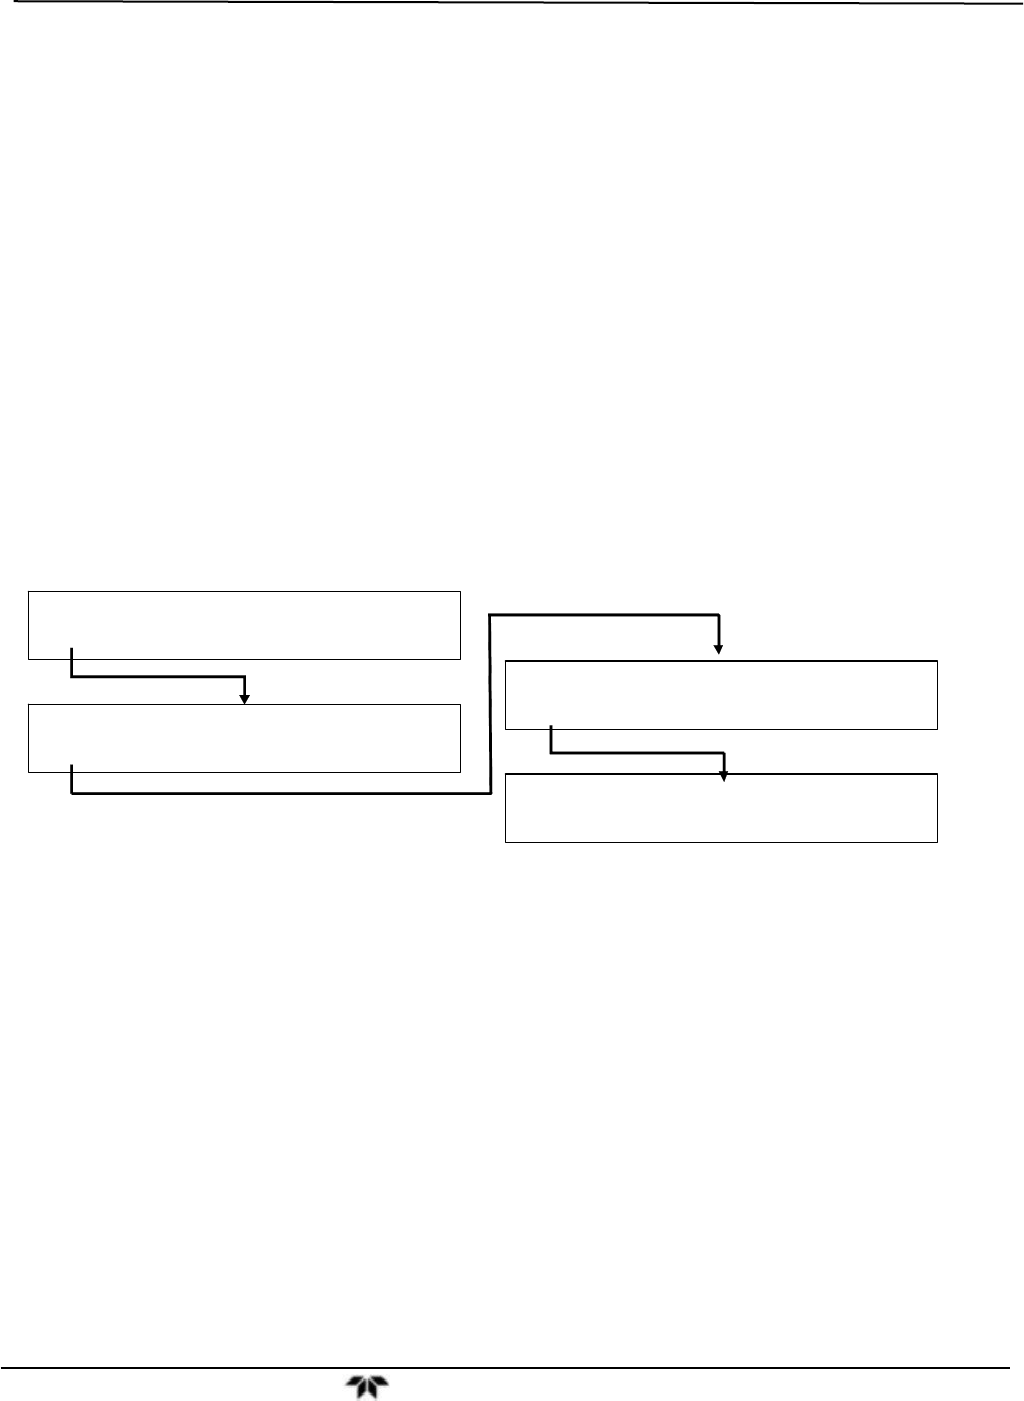
Two conditions must be simultaneously met to switch to the short filter. First the instantaneous
concentration must exceed the average in the long filter by a fixed amount. Second the instantaneous
concentration must exceed the average in the long filter by a portion, or percentage, of the average in the
long filter.
9.5.2. Calibration - Slope and Offset
Calibration of the analyzer is performed exclusively in software.
During instrument calibration (see Section 7) the user enters expected values for zero and span via the
front panel touchscreen and commands the instrument to make readings of calibrated sample gases for
both levels. The readings taken are adjusted, linearized, and compared to the expected values, With this
information the software computes values for instrument slope and offset and stores these values in
memory for use in calculating the CO
2
concentration of the sample gas.
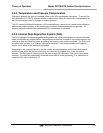
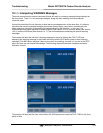
The instrument slope and offset values recorded during the last calibration can be viewed by pressing the
following touchscreen button sequence:
SAMPLE RANGE = 50.0 MGM CO2
=XX.XX
SAMPLE TIME = 16:23:34 CO2
=XX.XX
SAMPLE OFFSET = 0.000 CO2
=XX.XX
SAMPLE SLOPE = 1.000 CO2
=XX.XX
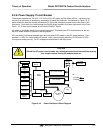
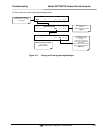
9.5.3. Measurement Algorithm
Once the IR photo-detector is signal is demodulated into CO2 MEAS and CO2 REF by the sync/demod
board and converted to digital data by the motherboard the GFC 7000TA analytical software calculates
the ratio between CO2 MEAS and CO2 REF. This value is compared to a look-up table is used, with
interpolation, to linearize the response of the instrument. The linearized concentration value is combined
with calibration slope and offset values, then normalized for changes in sample gas pressure to produce
the final CO
2
concentration. This is the value that is displayed on the instrument front panel display and is
stored in memory by the analyzer’s DAS system.