


ARENA / RANGER USER GUIDE
EN2Z-0906GE51 R0708 120
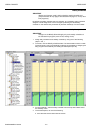
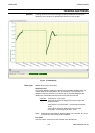
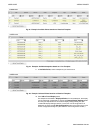
You can define a time window (“Last xx minutes”) and a time range (“Stop after yy
hours”).
ARENA will automatically displaying the controller values. After the elapse of the
time window, the oldest values will begin disappearing and new values will be added
on.
This will be continued until the time range has elapsed. Thus, you are shown the
actual values for the last xx minutes until yy hours have elapsed.
Example:
Last = 15 minutes, Stop after: 6 hours
Trend data of the latest 15 minutes is continuously saved and
displayed within 1 day after starting the trend.
The values can be saved to the ARENA database for performing a historical trend
later.
NOTE: Live trend is only possible on site level and on levels below and ARENA
must be connected.
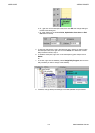
Trend Templates Each trend is based on a template which saves the trended datapoints (not the
values) and display settings (display type, time interval). Thus templates allow the
easy reuse of trend settings once defined. ARENA provides two default templates,
the Live trend template for Live trends and the Historic trend template for historical
trends. Before firstly using a default template it contains only the display settings but
no datapoints. New templates can be created.
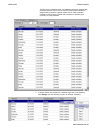
Trend Data Export Trend data can be exported as .CSV file to MS Excel.
Trending and System Performance Trending increases bus traffic and requires system resources. Hence, for historical
trends, it is recommended to avoid adding more datapoints to trend than absolutely
necessary. For Live trends, it is recommended to avoid storing datapoints in the
database unless absolutely necessary.
Procedures
For both trend types, the basic procedure can be described as:
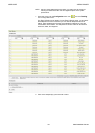
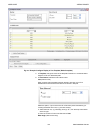
1. Record Trend Data
Here you select datapoints to be trended. For historical trends, the values of the
selected datapoints are continuously saved in the ARENA database. For Live
trends, the values of the selected datapoints are not saved in the database by
default, but they can be saved during the live trend when Analyzing the Trend
Data in step 2.
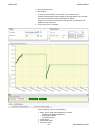
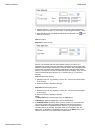
2. Analyze Trend Data
Here you do the following:
• Select datapoints for display
• Configure display
• Define time interval and
• Start trending
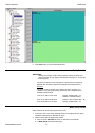
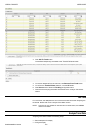
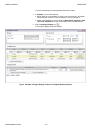
Record Trend Data
Historical Trend
Here you select the datapoints to be trended. The values of the selected datapoints
are continuously saved in the ARENA database. This collection of trend data occurs
in the background.
NOTE: Historical trend is possible on all levels (station, site, controller, etc.) and in
connected and disconnected states of ARENA.