


Menu Functions
Display Menu 5
5-11
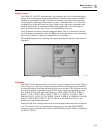
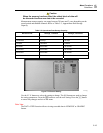
avu013.jpg
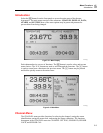
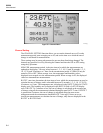
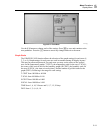
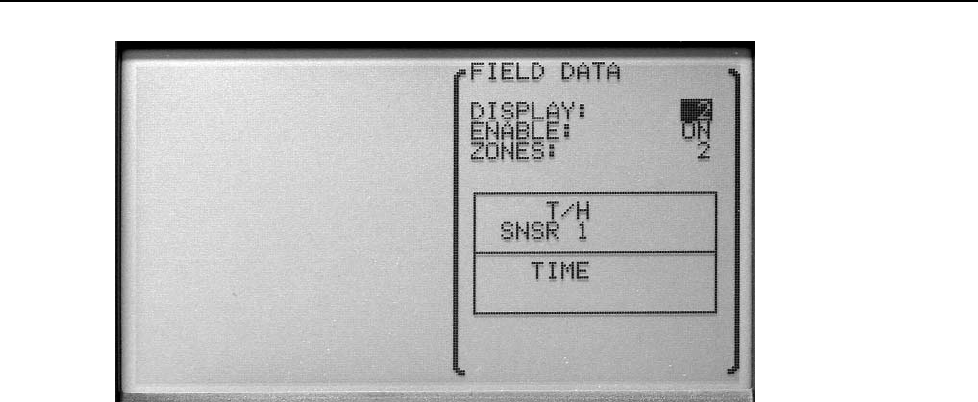
Figure 5-12. Field Data
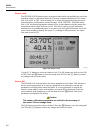
Use the B C buttons to change each of the settings. Press E to save and continue to the
next parameter. Press the F button to cancel any changes and exit to the menu.
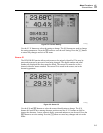
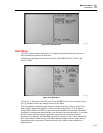
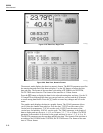
Graph Scale
The GRAPH SCALE function allows the selection of the graph settings for each zone (1,
2, 3, or 4). Graph settings for each zone are used in common among all display layouts.
This may be password-protected. For each zone you may set the center of the vertical
axes for the temperature graphs (T CENT), the temperature scale for the axes (T SCAL),
the center of the vertical axes for the humidity graphs (H CENT), the humidity scale for
the axes (H SCAL), the time axis scale (time), and the number of grid divisions for the
graph (DIVS). Following is the range for each setting:
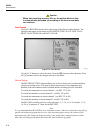
T CENT from 100.000 to -40.000
T SCAL from 100.000 to 0.100
H CENT from 100.000 to 0.000
H SCAL from 100.000 to 1.000
TIME from 1, 4, 10, 24 hours and 2, 5, 7, 15, 30 days
DIVS from 1, 2, 4, 6, 8, 10