


Specifications and Application Information 99
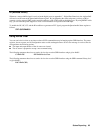
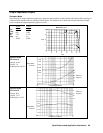
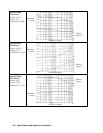
Output Impedance Graphs
Simulator Mode
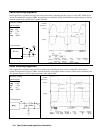
The following six output impedance graphs were generated at three points on both Agilent SAS models while operating in
simulator mode with the reference settings indicated below. The reference curve shows the location of the three sample
points on which the output impedance graphs are based.
Voc
Vmp
Imp
Isc
Pmp
Agilent
E4350B
65V
60V
7.5A
8A
450W
Agilent
E4351B
130V
120V
3.75A
4A
450W
0
2/1
4/2
6/3
8/4
0
10/
20
20/
40
30/
60
40/
80
50/
100
60/
120
65/
130
Vout
Iout
Test Point #1
Test Point #2
Test Point #3
Reference Curve
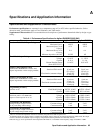
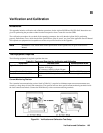
Agilent E4350B
Test Point #1
Voltage: 64.4 V
Current: 1 A
dc Resistance: 0.62
Ω
Impedance
in ohms
1.125
1.000
0.875
0.750
0.625
0.500
5
0
4
0
3
0
2
0
1
0
0
Frequency in Hertz
Phase in
degrees
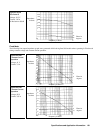
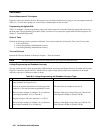
Agilent E4350B
Test Point #2
Voltage: 60 V
Current: 7.5 A
dc Resistance: 4.3 Ω
Impedance
in ohms
10
0
-10
-20
-30
20
6.25
5.00
3.75
2.50
1.25
Frequency in Hertz
Phase in
degrees