


Specifications and Application Information 103
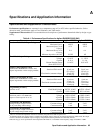
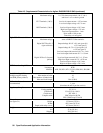
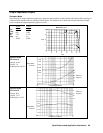
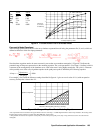
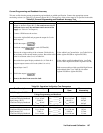
Voc
Vmp
Imp
Isc
Pmp
Agilent
E4350B
65V
60V
7.5A
8A
450W
Agilent
E4351B
130V
120V
3.75A
4A
450W
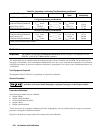
0 100 200 300 400 500 600 700 800 900 1000
-
5
-
3
-
1
0
-2
-
4
-
6
-7
-
8
-
9
-1
0
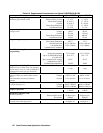
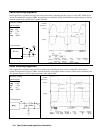
V-I Sweep Frequency in Hertz
Power Error
as a Percent
of 450W Pmp
At -15% of Peak Power
At -10% of Peak Power
At -5% of Peak Power
Figure A- 1. Percent Power Error in Simulator Mode
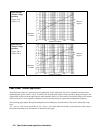
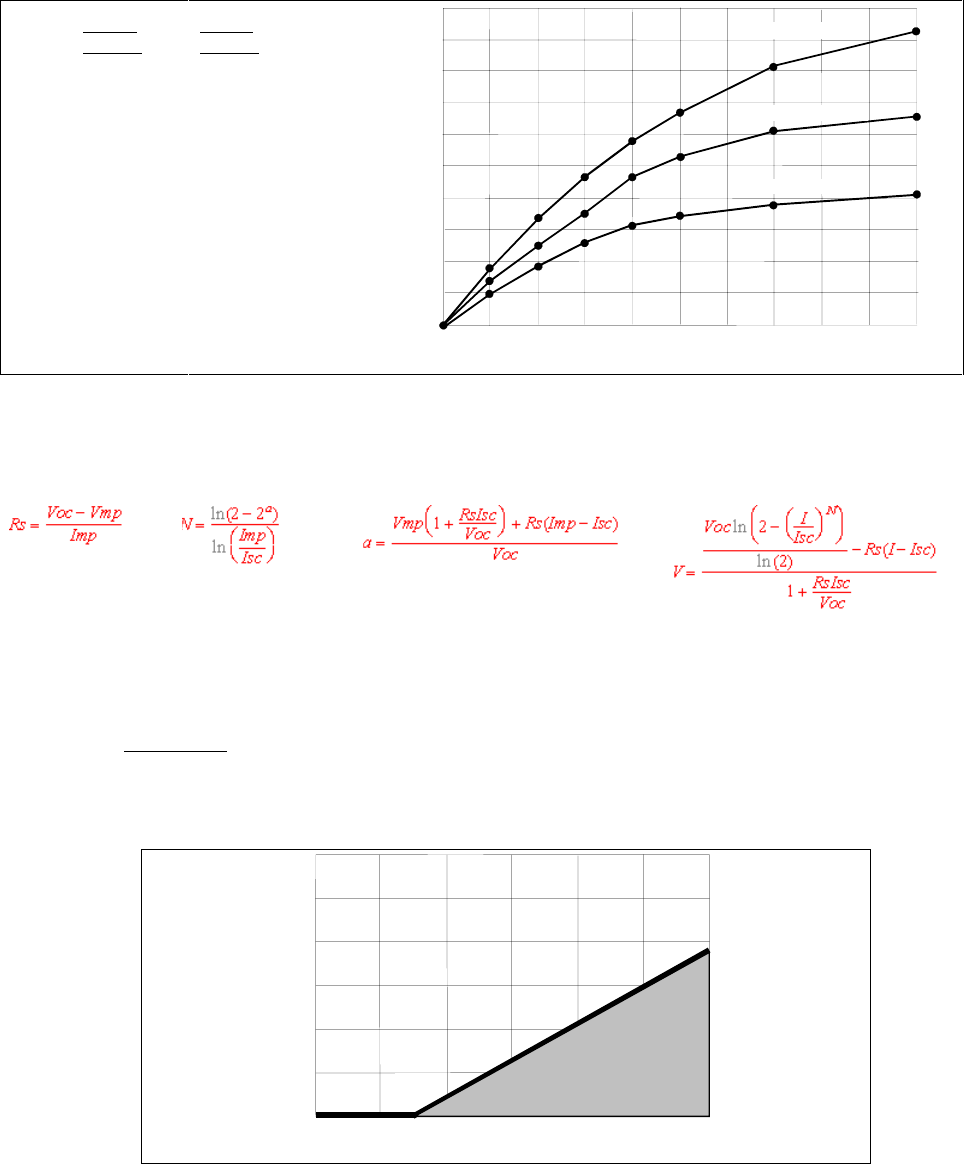
Exponential Model Equations*
The following equations describe the solar array simulator exponential model using the parameters Rs, N, and a, which are
defined as functions of the four input parameters.
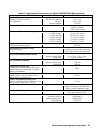
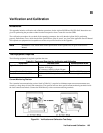
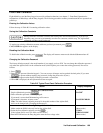
Note that these equations tend to be most accurate for curves that are somewhat rectangular.** Figure A-2 indicates the
potential range of Pmp error percent due to the modeling equation. The x-axis parameter is (Voc/Vmp) * (Isc/Imp), which is
a measure of the rectangularity of the simulator curve, with values near 1 being highly rectangular. The y-axis is a measure
of the possible error of the curve algorithm equation at the peak power point as defined by the following equation:
()()
%*%Pmp
Equation
IV
error
Pmp
mp mp
=−
1100
For example, a curve with the reference settings described in figure A-1 gives an x-axis value of 1.16, with an equation
accuracy for Pmp that is better than 1%.
25
15
5
Measure of Rectangularity (Voc/Vmp) * (Isc/Imp)
E
q
uation % Pmp Error
1 1.1 1.2 1.3 1.4 1.5 1.6
0
10
20
30
Figure A-2. Range of Pmp Error Due to Modeling Equation
*The exponential model is described in the paper: Britton, Lunscher, and Tanju, "A 9 KW High-Performance Solar Array Simulator", Proceedings of the
European Space Power Conference, August 1993 (ESA WPP-054, August 1993).
**The potential error between the equation’s actual peak power and the expected peak power (Vmp * Imp) will increase as the curves become less
rectangular.