


Chapter 5 Classical Feedback Analysis
Xmath Control Design Module 5-10 ni.com
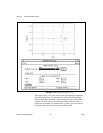
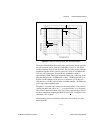
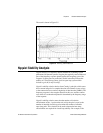
Referring to Figure 5-4, notice the additional lines drawn on the plots at
the frequencies where the gain crosses the 0 dB line and where the phase
crosses the 180° line. When the gain crosses the 0 dB line, the phase is
about –168°, 12° away from –180°. So the phase margin is approximately
12°. Similarly, when the phase crosses the –180° line, the gain is about
–44 dB (44 dB from the 0 dB line), and thus the gain margin is 44 dB.
bode( )
[H,dB,Phase] = bode(Sys,{F,keywords})
The bode( ) function uses freq( ) to compute the frequency response
of a system. By default, the
freq( ) keyword track is on, but it can be
overridden. Refer to the freq( ) section for more details. When the
frequency response
H is found the decibel magnitude and the phase angle
in degrees are computed as follows:
dB=20*log10(abs(H); phase=(180/pi)*atan(H)
bode( ) then produces the standard Bode format plots showing response
magnitude and phase as functions of frequency. Unlike
freq( ), bode( )
does not require a frequency range or a pair of maximum and minimum
frequencies; if no range is specified, it uses
deffreqrange( ) to
calculate a default frequency range.
bode( ) often generates more than one set of plots. For MIMO systems, a
plot is made for each output with multiple curves, one per input. If there are
multiple outputs, a menu will appear which allows you to select an input to
view.
If you want to see the response of the system from Example 5-2 to input
frequencies ranging from 0.01 Hz to 10 Hz, you can analyze a frequency
response using
bode( ), as shown in Example 5-3.
Example 5-3 Analyzing a Frequency Response Using bode( )
sys = polynomial(-0.5)/polynomial([0,0,-2,-10]);
[H,dB,phase]=bode(sys,
{Fmin = 0.01,Fmax=10,npts = 300,!wrap})
You obtain the gain and phase plots as shown in Figure 5-4.