Using the System
2-8 September 2000
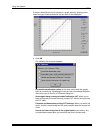
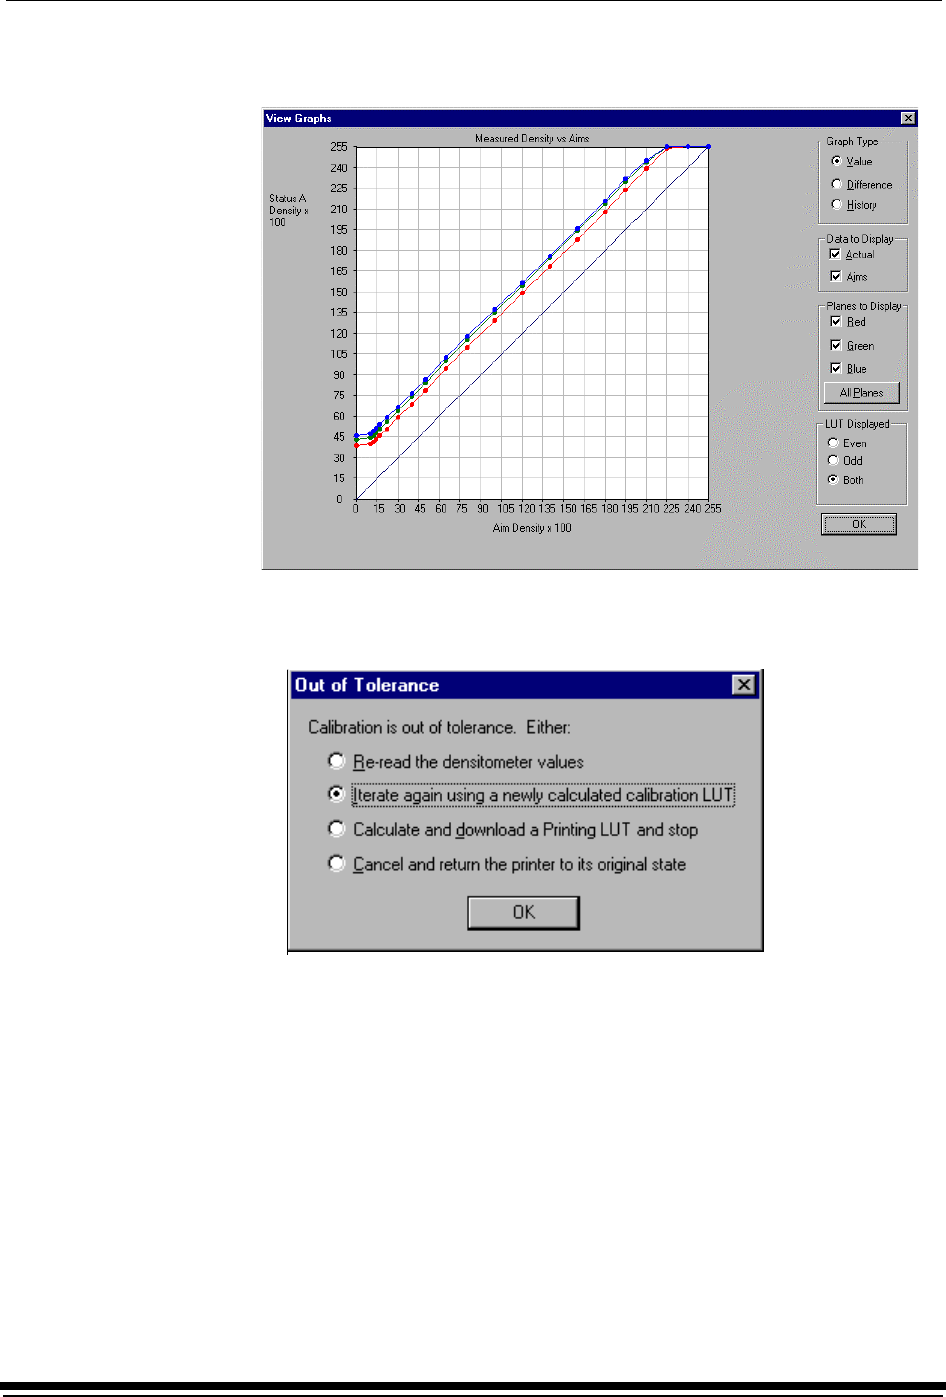
If the print densities are out of tolerance, a graph appears, allowing you to
select the type of data and planes that you want to see displayed.
a. Click OK.
The following list of options appears.
Re-read the densitometer values is the most useful when the graphs
show an unusual plot. Rereading the test print lets you validate the graph,
then returns you to the Out of Tolerance dialog box.
Iterate again using a newly calculated calibration LUT allows you to
keep printing test prints with the newly created LUT without having to save
the LUT table.
Calculate and download a printing LUT and stop: When you select this
option, the file is saved and given the same creation date and time as the
name.
Cancel and return the printer to its original state saves nothing. Any
corrupted data created after you saved the last time is thrown away.


