


84
Chapter 12
Plots
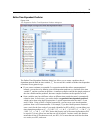
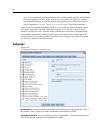
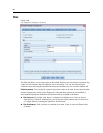
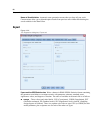
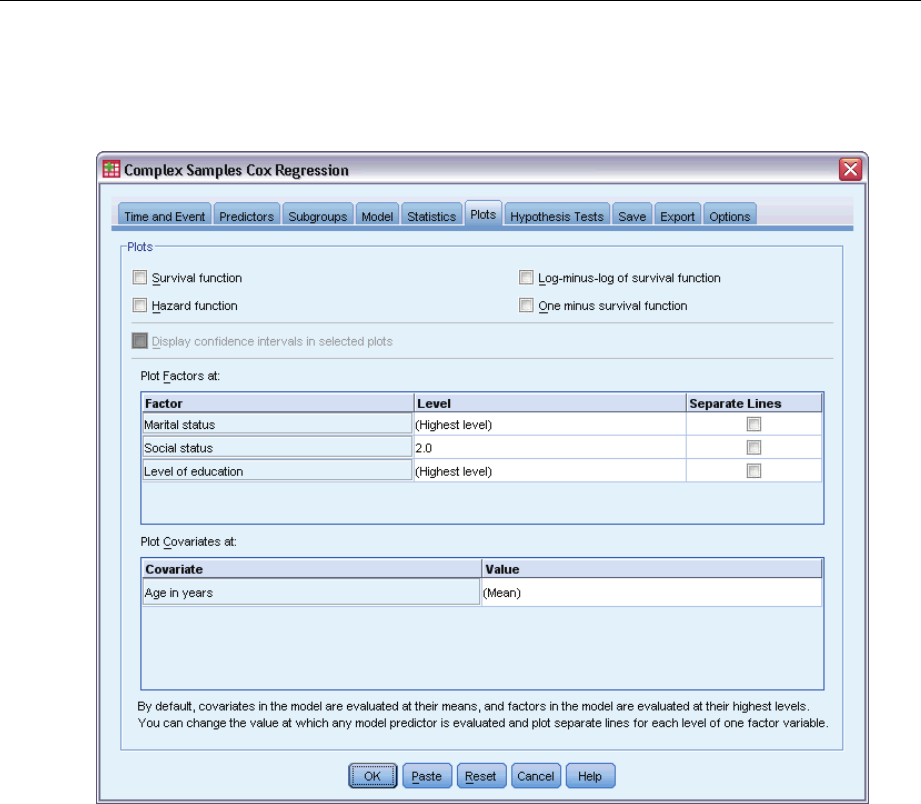
Figure 12-8
Cox Regression dialog box, Plots tab
The Plots tab allows you to request plots of the hazard function, survival function, log-minus-log
of the survival function, and one minus the survival function. You can also choose to plot
confidence intervals along the specified functions; the confidence level is set on the Options tab.
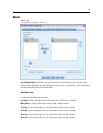
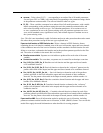
Predictor patterns. You can specify a pattern of predictor values to be used for t he requested plots
and the exported survival file on the Export tab. Note that these options are not available if
time-dependent predictors defined on the Predictors tab are included in the model.
Plot Factors at. By default, each factor is evaluated at its highest level. Enter or select a
different level if desired. Alternatively, you can choose to plot separate lines for each level
of a single factor by selecting the check box for that factor.
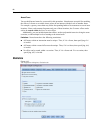
Plot Covariates at. Each covariate is evaluated at its mean. Enter or select a different value
if desired.