


203
Complex Samples Ordinal Regression
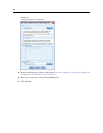
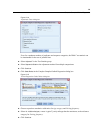
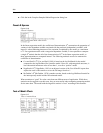
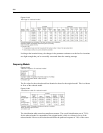
Figure 21-10
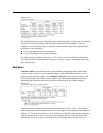
Classification table
The classification table shows the practical results of using the model. For each case, the predicted
response is the response category with the highest model-predicted probability. Case
sare
weighted by Final Sampling Weight, so that the classification table reports the expected model
performance in the population.
Cells on the diagonal are correct predictions.
Cells off the diagonal are incorrect predictions.
The model correctly classifies 9.9% more, or 37.2% of the cases. In particular, the model does
considerably better at classifying those who Agree or Strongly disagree, and slightly worse with
those who Disagree.
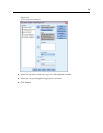
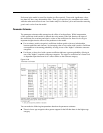
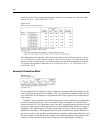
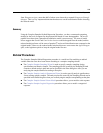
Odds Ratios
Cumulative odds are defined as the ratio of the probability that the dependent variable takes
a value less than or equal to a given response category to the probability that it takes a value
greater than that response category. The cumulative odds ratio is the ratio of cumulative odds
for different predictor values and is closely related to the exponentiated parameter estimates.
Interestingly, the cumulative odds ratio itself does not depend upon the response category.
Figure 21-11
Cumulative odds ratios for Age category
This table displays cumulative odds ratios for the factor levels of Age category. The reported
values are the ratios of the cumulative odds for 18–30 through 46–60,comparedtothecumulative
odds for >60. Thus, the odds ratio of 1.383 in the first row of the table means that the cumulative
odds for a person aged 18–30 are 1.383 times the cumulative odds for a person older than 60.
Note that because Age category is not involved in any interaction terms, the odds ratios are