


193
Complex Samples Logistic Regression
Odds Ratios
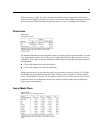
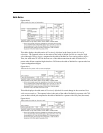
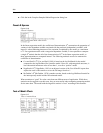
Figure 20-10
Odds ratios for level of education
This table displays the odds ratios of Previously defaulted at the factor levels of Level of
education. The reported values are the ratios of the odds of default for Did not complete high
school through College degree, compared to the odds of default for Post-undergraduate degree .
Thus, the odds ratio of 2.054 in the first row of the table means that the odds of default for a
person who did not complete high school are 2.054 times the odds of default for a person who has
a post-undergraduate degree.
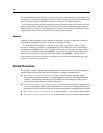
Figure 20-11
Odds ratios for years with current employer
This table displays the odds ratio of Previously defaulted for a unit change in the covariate Years
with current employer. The reported value is the ratio of the odds of default for a person with 7.99
years at their current job compared to the odds of default for a person with 6 .99 years (the mean).
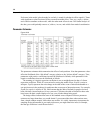
Figure 20-12
Odds ratios for debt to income ratio