


104
Chapter 13
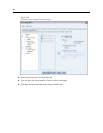
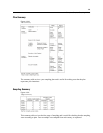
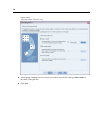
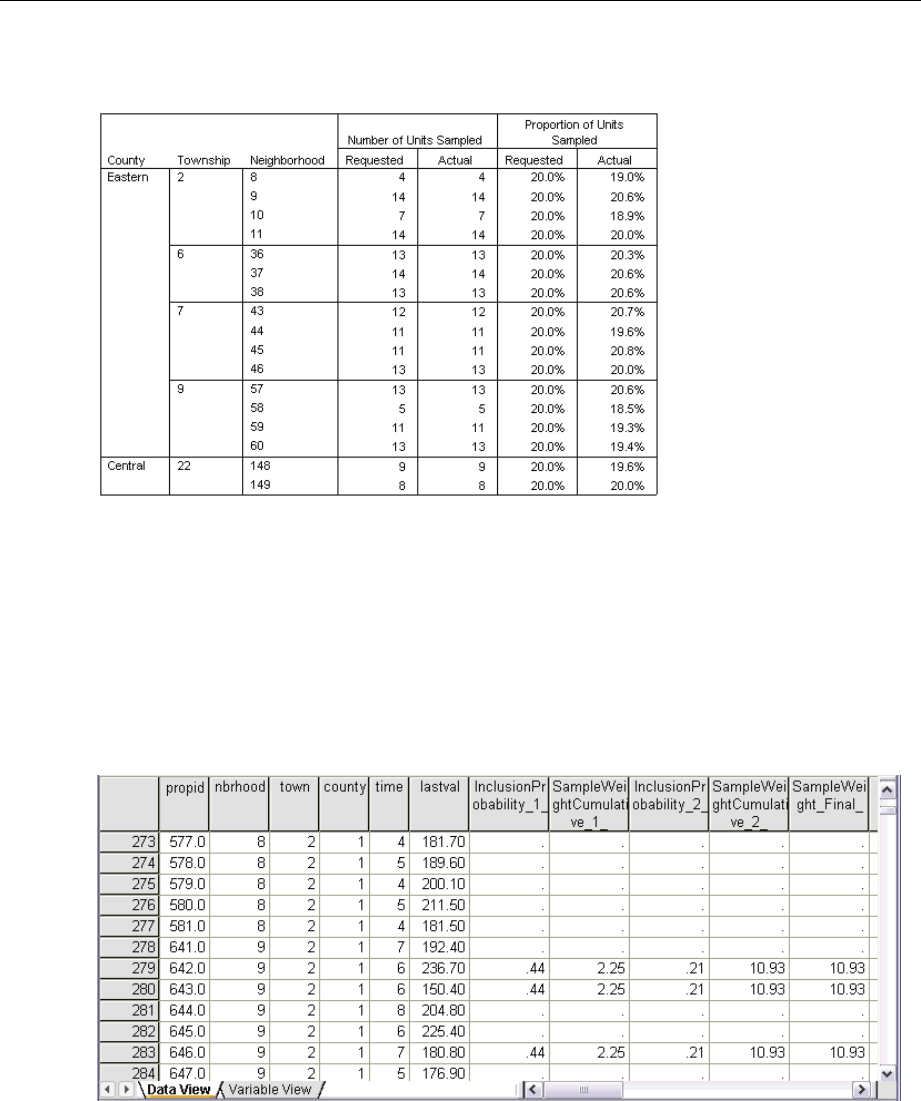
Figure 13-12
Stage summary
This summary table (the top part of which is shown here) reviews the second stage of sampling.
It is also useful for checking that the sampling went according to plan. Approximately 20% of
the properties were sampled from each neighborhood from each township sampled in the first
stage, as requested.
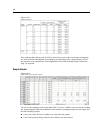
Sample Results
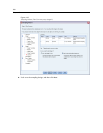
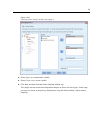
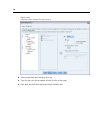
Figure 13-13
Dat a E dito r with sample results
You can see the sampling results in the Data Editor. Five new variables were saved to the working
file, representing the inclusion probabilities and cumulative sampling weights for each stage, plus
the final sampling weights.
Cases with values for these variables were selected to the sample.
Cases with system-missing values for the variables were not selected.