


190
Chapter 20
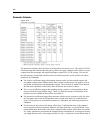
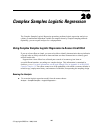
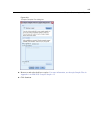
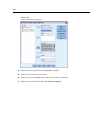
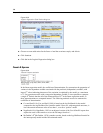
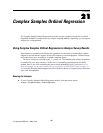
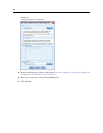
Figure 20-5
Logistic Regression Odds Ratios dialog box
E Choose to create odds ratios for the factor ed and the covariates employ and debtinc.
E Click Continue.
E Click OK in the Logistic Regression dialog box.
Pseudo R-Squares
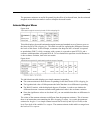
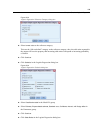
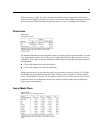
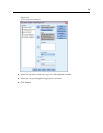
Figure 20-6
Pseudo R-square statistics
In the linear regression model, the coefficient of determination, R
2
, summarizes the proportion of
variance in the dependent variable associated with the p redictor (independent) variables, with
larger R
2
values indicating that more of the variation is explained by the model, to a maximum
of 1. For regression models with a categorical dependent variable, it is not possible to compute
asingleR
2
statistic that has all of the characteristics of R
2
in the linear regression model, so
these approximations are computed instead. The following methods are used to estimate the
coefficient of determination.
Cox and Snell’s R
2
(Cox and Snell, 1989) is based on the log likelihood for the model
compared to the log likelihood for a baseline model. However, with categorical outcomes, it
has a theoretical maximum value of less than 1, even for a “perfect” model.
Nagelkerke’s R
2
(Nagelkerke, 1991) is an adjusted version of the C ox & Snell R-square that
adjusts the scale of the statistic to cover the full range from 0 to 1.
McFadden’s R
2
(McFadden, 1974) is another version, based on the log-likelihood kernels for
the intercept-only model and the full estimated model.