


168
Chapter 17
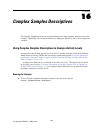
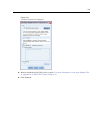
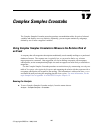
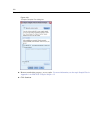
Figure 17-3
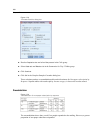
Crosstabs Statistics dialog box
E Deselect Population s ize and select Row percent in the Cells group.
E Select Odds ratio and Relative risk in the Summaries for 2-by-2 Tables group.
E Click Continue.
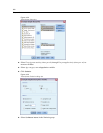
E Click OK in the Complex Samples Crosstabs dialog box.
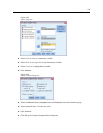
These selections produce a crosstabulation table and risk estimate for Newspaper subscription by
Response. Separate tables with results split by Income category in thousands are also created.
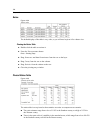
Crosstabulation
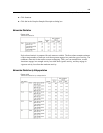
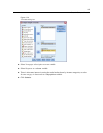
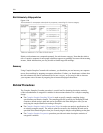
Figure 17-4
Crosstabulation for newspaper subscription by response
The crosstabulation shows that, overall, few people responded to the mailing. However, a greater
proportion of newspaper subscribers responded.