


204
Chapter 21
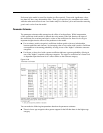
merely the ratios of the exponentiated parameter estimates. For example, the cumulative odds
ratio for 18–30 vs. >60 is 1.00/0.723 = 1.383.
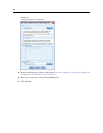
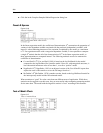
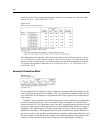
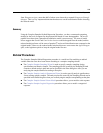
Figure 21-12
Odds ratios for driving frequency
This table displays the cumulative odds ratios for the factor levels of Driving frequency,using
10–14,999 miles/year as the reference category. Since Driving frequency is not involved in any
interaction terms, the odds ratios are merely the ratios of the exponentiated parameter estimates.
For example, the cumulative odds ratio for 20–29,999 miles/year vs. 10–14,999 miles/year is
0.101/0.444 = 0.227.
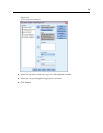
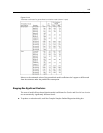
Generalized Cumulative Model
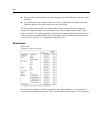
Figure 21-13
Test of parallel lines
The test of parallel lines can help you assess whether the assumption that the parameters are the
same for all response categories is reasonable. This test compares the estimated model with one
set of coefficients for all categories to a generalized model with a separate set of coefficients for
each category.
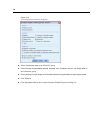
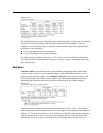
The Wald F test is an omnibus test of the contrast matrix for the parallel lines assumption that
provides asymptotically correct p values; for small to mid-sized samples, the adjusted Wald F
statistic performs well. The significance value is near 0.05, suggesting that the generalized model
maygiveanimprovementinthemodelfit; however, the Sequential Sidak adjusted test reports a
significance value high enough (0.392) that, overall, there is no clear evidence for rejecting the
parallel lines assumption. The Sequential Sidak test starts with individual contrast Wald tests to
provide an o verall p value, and these results should be comparable to the omnibus Wald test result.
The fact that they are so different in this example is somewhat surprising but could be due to the
existence of many contrasts in the test and a relatively small design degrees of freedom.