


208
Chapter 21
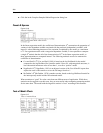
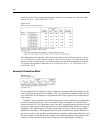
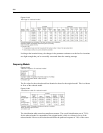
Figure 21-18
Warnings for reduced model
Looking at the iteration history, the changes in the parameter estimates over the last few iterations
are slight enough that you’re not terribly concerned about the warning message.
Comparing Models
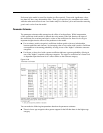
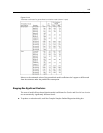
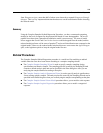
Figure 21-19
Pseudo R-Squares for reduced model
The R
2
values for the reduced model are identical to those for the original model. This is evidence
in favor of the reduced model.
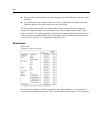
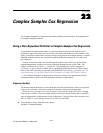
Figure 21-20
Classification table for reduced model
The classification table somewhat complicates matters. The overall classification rate of 37.0%
for the reduced model is comparable to the original model, which is evidence in favor of the
reduced model. However, the reduced model shifts the predicted response of 3.8% of the voters