


39
Complex Samples Crosstabs
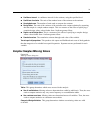
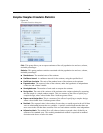
Complex Samples Crosstabs Statistics
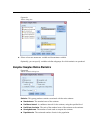
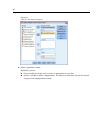
Figure 7-2
Crosstabs Statistics dialog box
Cells. This group allows you to request estimates of the cell population size and row, column,
and table percentages.
Statistics. This group produces statistics associated with the population size and row, column,
and table percentages.
Standard error. The standard error of the estimate.
Confidence interval. Aconfidence interval for the estimate, using the specified level.
Coefficient of variation. The ratio of the standard error of the estimate to the estimate.
Expected values. The expected value of the estimate, under the hypothesis of independence
of the row and column variable.
Unweighted count. The number of units used to compute the estimate.
Design effect. The ratio of the variance of the estimate to the variance obtained by assuming
that the sample is a simple random sample. This is a measure of the effect of specifying a
complex design, where values further from 1 indicate greater effects.
Square root of design effect. This is a measure of the effect of specifying a complex design,
where values further from 1 indicate greater effects.
Residuals. The expected value is the number of cases that you would expect in the cell if there
were no relationship between the two variables. A positive residual indicates that there are
more cases in the cell than there would be if the row and column variables were independent.
Adjusted residuals. The residual for a cell (observed minus e xpected value) divided by an
estimate of its standard error. The resulting standardized residual is expressed in standard
deviation units above or below the mean.