


Chapter
7
Complex Samples Crosstabs
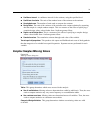
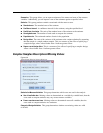
The Complex Samples Crosstabs procedure produces crosstabulation tables for pairs of selected
variables and displays two-way statistics. Optionally, you can request statistics by subgroups,
defined by one or more categorical variables.
Example. Using the Complex Samples Crosstabs procedure, you can o btain cross-classification
statistics for smoking frequency by vitamin usage of U.S. citizens, based on the results of the
National Health Interview Survey (NHIS) and with an appropriate analysis plan for this public-use
data.
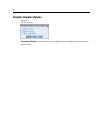
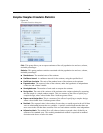
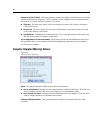
Statistics. The procedure produces estimates of cell population sizes and row, column, and table
percentages, plus standard errors, confidence intervals, coefficients of variation, expected values,
design effects, square roots of design effects, residuals, adjusted residuals, and unweighted counts
for each estimate. The odds ratio, relative risk, and risk difference are computed for 2-by-2 tables.
Additionally, Pearson and likelihood-ratio statistics are computed for the test of independence of
the row and column variables.
Data. Row and column variables should be categorical. Subpopulation variables can be string or
numeric but should be categorical.
Assumptions. The cases in the data file represent a sample from a complex design that should
be analyzed according to the specifications in the file selected in the Complex Samples Plan
dialog box.
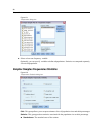
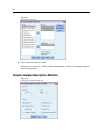
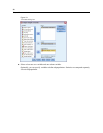
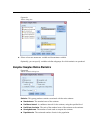
Obtaining Complex Samples Crosstabs
E From the menus choose:
Analyze > Complex Samples > Crosstabs...
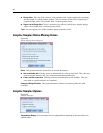
E
Select a plan file. Optionally, select a custom joint probabilities file.
E Click Continue.
© Copyright SPSS Inc. 1989, 2010
37