


20 0
Chapter 21
E
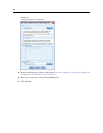
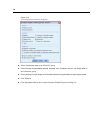
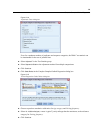
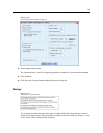
Click OK in the Complex Samples Ordinal Regression dialog box.
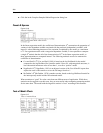
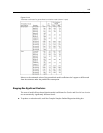
Pseudo R-Squares
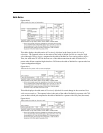
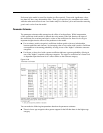
Figure 21-6
Pseudo R-Sq uares
In the linear regression model, the coefficient of determination, R
2
, summarizes the proportion of
variance in the dependent variable associated with the p redictor (independent) variables, with
larger R
2
values indicating that more of the variation is explained by the model, to a maximum
of 1. For regression models with a categorical dependent variable, it is not possible to compute
asingleR
2
statistic that has all of the characteristics of R
2
in the linear regression model, so
these approximations are computed instead. The following methods are used to estimate the
coefficient of determination.
Cox and Snell’s R
2
(Cox and Snell, 1989) is based on the log likelihood for the model
compared to the log likelihood for a baseline model. However, with categorical outcomes, it
has a theoretical maximum value of less than 1, even for a “perfect” model.
Nagelkerke’s R
2
(Nagelkerke, 1991) is an adjusted version of the C ox & Snell R-square that
adjusts the scale of the statistic to cover the full range from 0 to 1.
McFadden’s R
2
(McFadden, 1974) is another version, based on the log-likelihood kernels for
the intercept-only model and the full estimated model.
What constitutes a “good” R
2
value varies between different areas of application. While these
statistics can be suggestive on their own, they are most useful when comparing competing models
for the same data. The model with the largest R
2
statistic is “best” according to this measure.
Tests of Model Effects
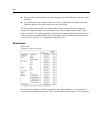
Figure 21-7
Tests of model effects