


83
Complex Samples Cox Regression
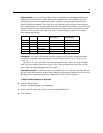
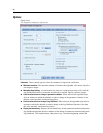
Sample desig n information. Displays summary information about the sample, including the
unweighted count and the population size.
Event and censoring summary. Displays summary information about the n umber and percentage of
censored cases.
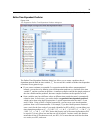
Risk set at event times. Displays number of events and number at risk for each event time in
each baseline stratum.
Parameters. This group allows you to control the display of statistics related to the model
parameters.
Estimate. Displays estimates of the coefficients.
Exponentiated estimate. Displays the base of the natural logarithm raised to the power of the
estimates of the coefficients. While the estimate has nice properties for statistical testing, the
exponentiated estimate, or exp(B), is easier to interpret.
Standard error. Displays the standard error for each coefficient e stimate.
Confidence interval. Displays a confidence interval for each coefficient estimate. The
confidence level for the interval is set in the Options dialog box.
t-test. Displays a t test of each coefficient estimate. The null hypothesis for each test is that the
value of the coefficient is 0.
Covariances of parameter estimates. Displays an estimate of the covariance matrix for the
model coefficients.
Correlations of parameter estimates. Displays an estimate of the correlation matrix for the
model coefficients.
Design effect. The ratio of the variance of the estimate to the variance obtained by assuming
that the sample is a simple random sample. This is a measure of the effect of specifying a
complex design, where values further from 1 indicate greater effects.
Square root of design effect. This is a measure of the effect of specifying a complex design,
where values further from 1 indicate greater effects.
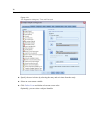
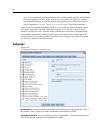
Model Assumptions. This group allows you to produce a test of the proportional hazards
assumption. The test compares the fittedmodeltoanalternative model that includes
time-dependen
tpredictorsx*_TF for each predictor x,where_TF is the specified time function.
Time Function
.
Specifies the form of _TF for the alternative model. For the identity function,
_TF=T_.Forthelog function, _TF=log(T_). For Kaplan-Meier, _TF=1−S
KM
(T_), where
S
KM
(.) is the Kaplan-Meier estimate of the s urvival function. For rank, _TF is the rank-order
of T_ among the o
bserved end times.
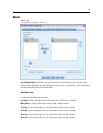
Parameter est
imates for alternative model.
Displays the estimate, standard error, and confidence
interval for each parameter in the alternative model.
Covariance matrix for alternative model. Displays the matrix of estimated covariances between
parameters in the alternative model.
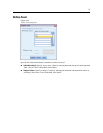
Baseline survival and cumulative hazard functions. Displays the baseline survival function and
baseline cumulative hazards function along with their standard errors.
Note: If time-dependent predictors defined on the Predictors tab are included in the model, this
option is not available.