


Instruction 3015-4275 53
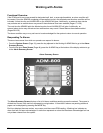
Working with the Trend Screen
Overview - Log Interval
The AGM300 retains a data log of 100 measurements for each zone. The log interval is the number of minutes
from 1 to 1440 between each log point. This parameter can be changed from the Zone Setup #1 Screen
(Page
41).
The default setting for this parameter is 1440 minutes (24 hours). If the log interval time is set to 0, then a
measurement is recorded in the trend log after every measurement cycle. Therefore, after the trend log is filled it
will contain the last 100 measurement points for a zone. If you want the data logged less frequently you should
increase this value. It is important to remember that cycle time is dependent on many factors, including the
number of zones being monitored, input line length, and the run zeroing mode selected. Before changing this
value it may be useful to first review the log data using the Trend Screen to determine the nominal cycle time.
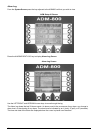
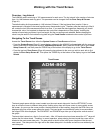
Navigating To the Trend Screen
Access the Trend Screen from either the System Screen or Zone Screen as follows:
• From the System Screen (Page
31) press the key adjacent to the AGM300 unit associated with the zone you
wish to work with to display that monitor's AGM Setup Screen #1. Next, press the ZONES key to go to Zone
Setup Screen #1, and then press the TREND key at the bottom of the display to go to the Trend Screen.
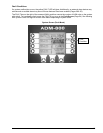
• From the top level Zone Screen (Page
44) press the key adjacent to the zone you wish to work with to first
display its Zone Setup Screen #1. Then press the TREND key at the bottom of the display to go to the Trend
Screen.
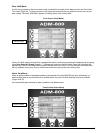
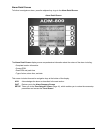
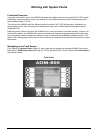
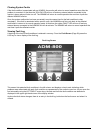
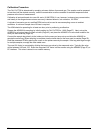
Trend Screen
The trend graph opens with the cursor located over the most recent data point. Use the LEFT/RIGHT cursor
keys to move the cursor to different data points. Holding a key down will cause cursor to move rapidly across
the screen. As you move the cursor position, the date and time of that reading, along with the PPM value, are
displayed at the top of the screen above the graph. The trend graph is automatically scaled to accommodate
the largest PPM value displayed. The ZOOM OUT and ZOOM IN keys allow you to adjust the vertical scale of
the graph.
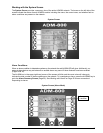
The trend data is stored on a first-in, first-out basis. After 100 trend values have been stored the 101
st
value will
replace the first value stored. Therefore, in normal operation, when entering the trend mode the cursor will be
located at the most recent data point. The data points to the left of the initial cursor location will be the next
most recent. The data point to the right will be the oldest data point in the buffer and will be over written by the
next data point.