


50
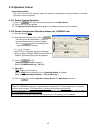
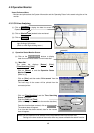
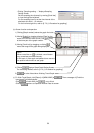
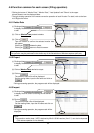
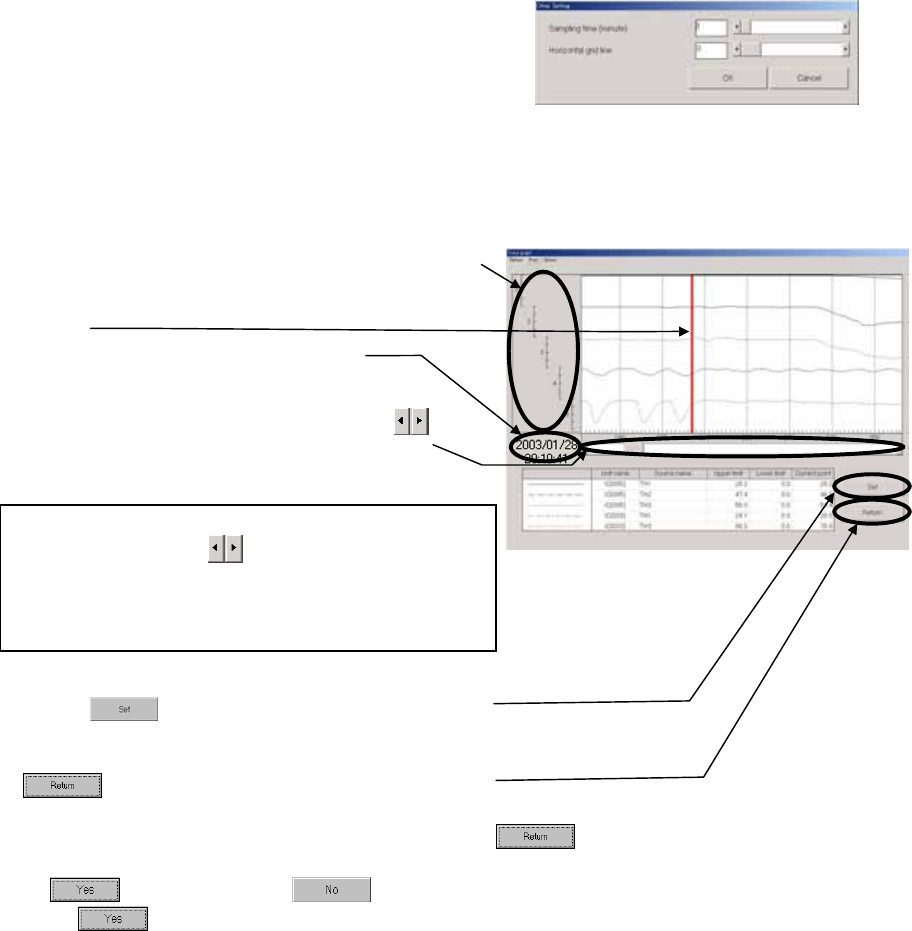
- Clicking "Sampling setting ---" displays Sampling
Setting Screen.
Set the sampling time (interval) by moving [Scroll bar]
or input through the keyboard.
For the sampling interval, set the time interval of the
abscissas axis with 1 ~10 minutes.
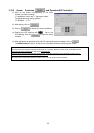
For the horizontal grid line, refer to [3.7.3 (1) Procedure for graphing].
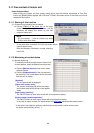
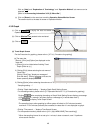
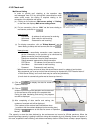
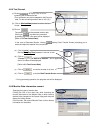
(b) Screen function and operation
1) Clicking [Graph number] makes the graph line bold.
2) Moving [Scaler] by dragging displays [Data] on the
scaler at the current value column, and [Date/Time]
at the lower part of the graph number.
3) Moving [Scroll bar] by dragging or clicking
moves the range of the graph being displayed.
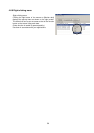
* NOTE
When a scroll bar or is clicked, a scroll button
may sometimes move continuously.
In this case, it clicks again and please let me move to
the position which wants to see graph.
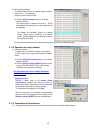
4) Clicking displays Graph Detail Setting Screen.
For the setting method, refer to [3.7.3 (1) Procedure for graphing].
5) is to be clicked when finishing Trend Graph.
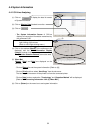
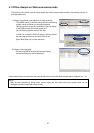
(c) To finish Trend Graph, click [Return] of [MENU BAR] or . Then a message of [Finish the
trend graph?] will be displayed.
Click to finish while click not to finish.
Clicking returns to Operation Monitor Data list screen.