49
- Click on [Help
] and “Explanation of Terminology” and “Operation Method” sub-menus can be
selected.
[Refer to 3.6 Connecting Information 3.6.2 (2) ”Menu Bar”]
(c) Click on [Return] on the menu bar to end the Operation Status Monitor Screen.
The screen returns to the data list screen of Operation Monitor.
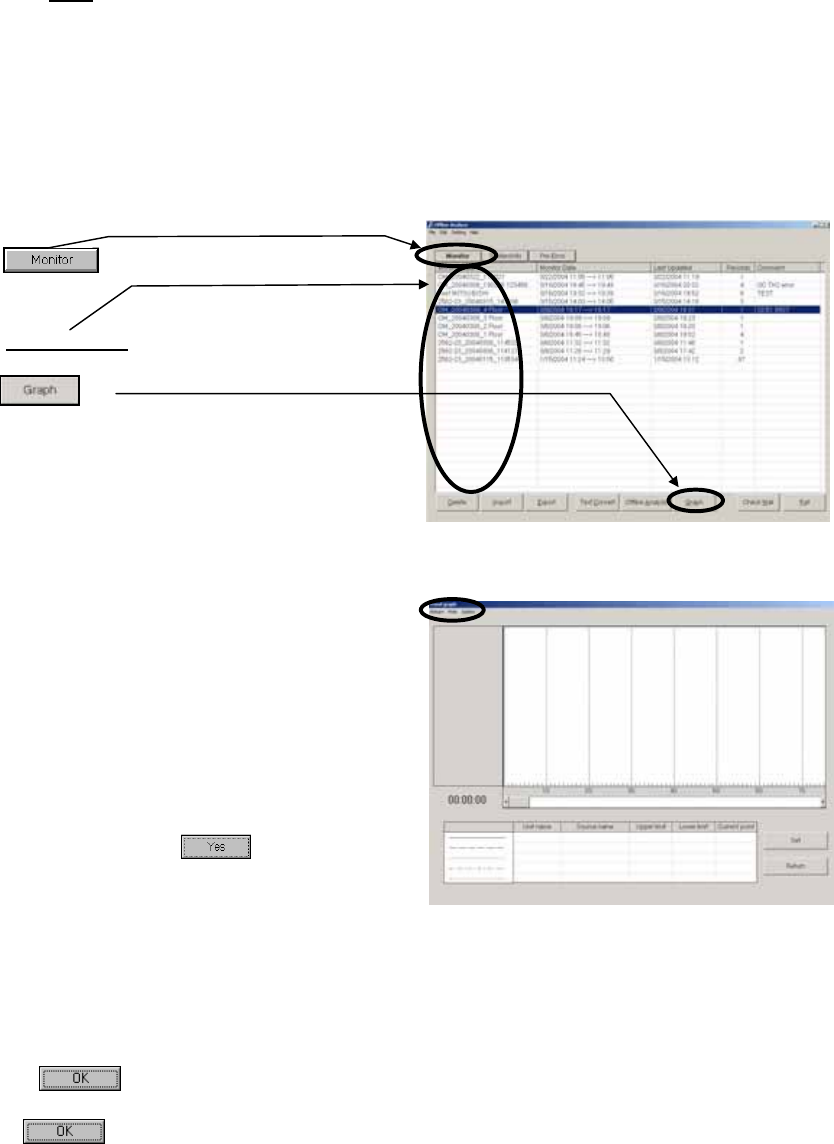
4.3.2 Graph
(1) Click on to display the data list screen of
Operation Monitor.
(2) Click on [Monitor Data
] desired to be monitored.
(3) Click on .
(4) Trend Graph Screen
*For the Procedure for graphing, please refer to [ 3.7.3 (1) Procedure for graphing].
(a) The menu bar
[Return], [Print] and [Option] are displayed on the
menu bar.
1) [Return] is to be clicked when finishing Trend
Graph. [Refer to (c).]
2) Clicking [Print] allows selecting the sub-menu of
"Hard Copy."
Clicking "Hard Copy" displays a message of
[Print the data?]. Clicking prints out the
screen presently displayed as it is.
3) Clicking [Option] allows selecting the sub-menu of "Graph detail setting ---", "Time search ---" and
"Sampling setting ---."
- Clicking "Graph detail setting ---" displays Graph Detail Setting Screen.
For the setting method, please refer to [3.7 Operation Monitor 3.7.3 (1) Procedure for graphing].
Clicking after completing the setting on Graph Detail Setting Screen displays a message
of [Please wait for a moment.] and then displays a message of [x-records data read !!].
Click to display Trend Graph Screen.
*The sampling time to allow graphing by offline system is limited to 1515 minutes (records)
maximum. If 1515 minutes (records) are exceeded, the data after it is not displayed on graph.
- Clicking "Time search ---" displays Time Search Screen.
For the operation method, please refer to [4.3.1 (4)(b) MENU BAR [Time searching]].
* When the sampling interval is not set up in 1 minute, it does not search, even if it performs
a time search function.


