


36
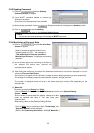
2) Clicking returns to Trend Graph Screen
displaying the horizontal grid line in the number being
set to the graph.
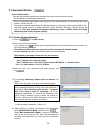
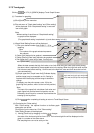
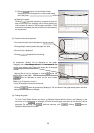
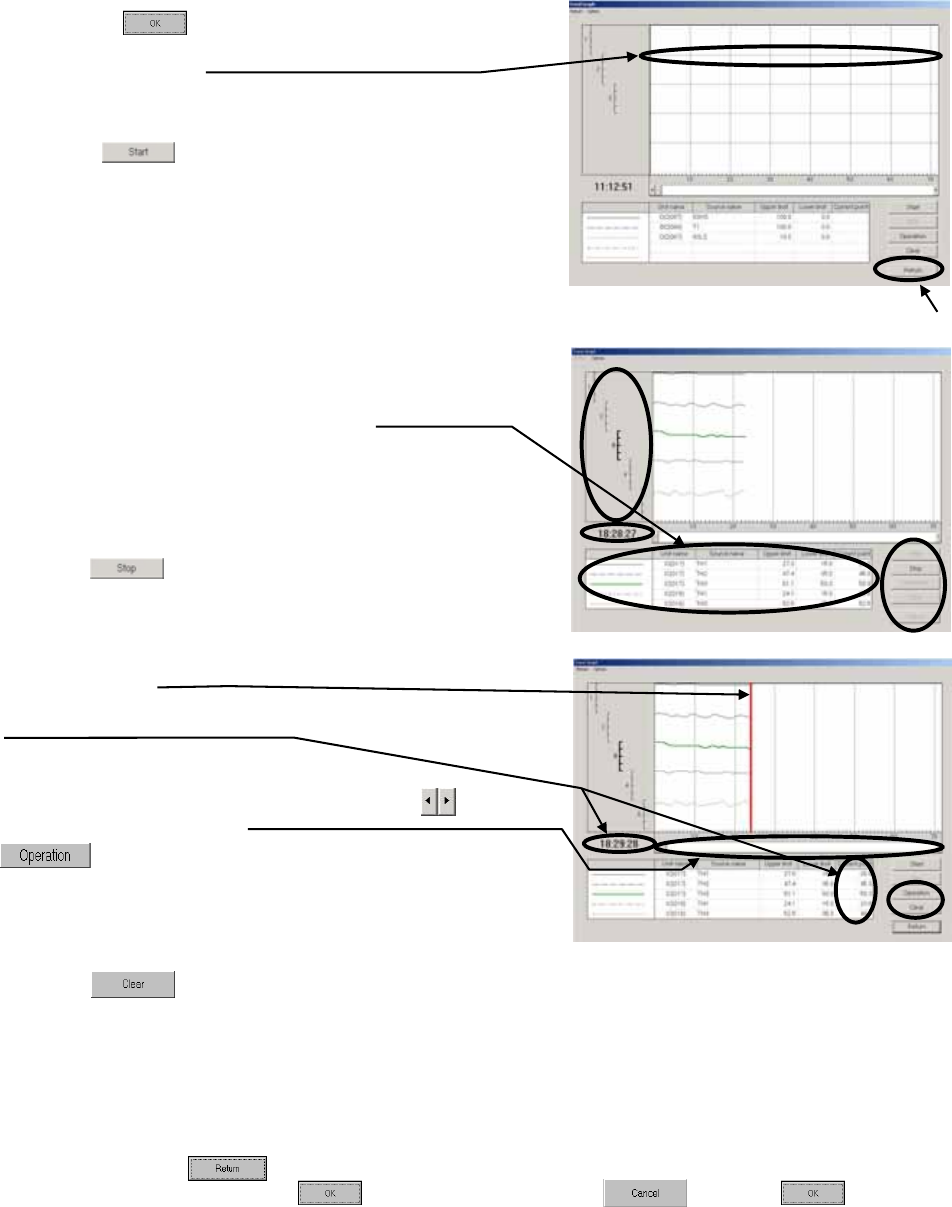
(e) Starting the graph
Clicking initiates monitoring to graph the data for
each one minute. The sampling time to allow graphing by
online system is limited to 500 minutes maximum. If 500
minutes are exceeded, the data of old time is eliminated by
the excess time.
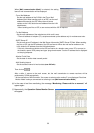
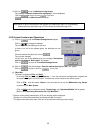
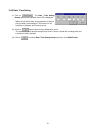
(2) Screen function and operation
- The current monitor data is displayed on [Lower column].
- Clicking [Graph number] makes the graph line bold.
- [Current time] is displayed.
- Clicking suspends the monitoring.
At suspension, [Scaler] will be displayed on the graph.
Dragging the scaler displays the data on the scaler at the
current value column and [Time] at the under part of the graph
number.
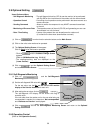
- Moving [Scroll bar] by dragging or clicking moves the
display range of the graph.
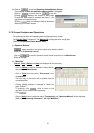
can be operated as same as the local remote
controller.
[Refer to 3.10 Operation control.]
* Here, BC operation cannot be carried out.
- Clicking clears the graph being displayed. The set values of the graph setting items and other
setting items will remain unchanged.
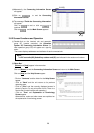
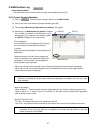
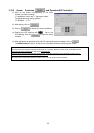
(3) Ending the graph
To finish Trend Graph Screen and return to Operation Status Monitor Screen, click [Return] on the
menu bar or click . A message of [Finish the trend graph and return to the monitor?] will be
displayed. For returning, click , while not returning, click . Clicking returns to
Operation Status Monitor Screen.
(
3
)
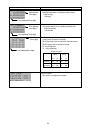
[Graph number]