


31
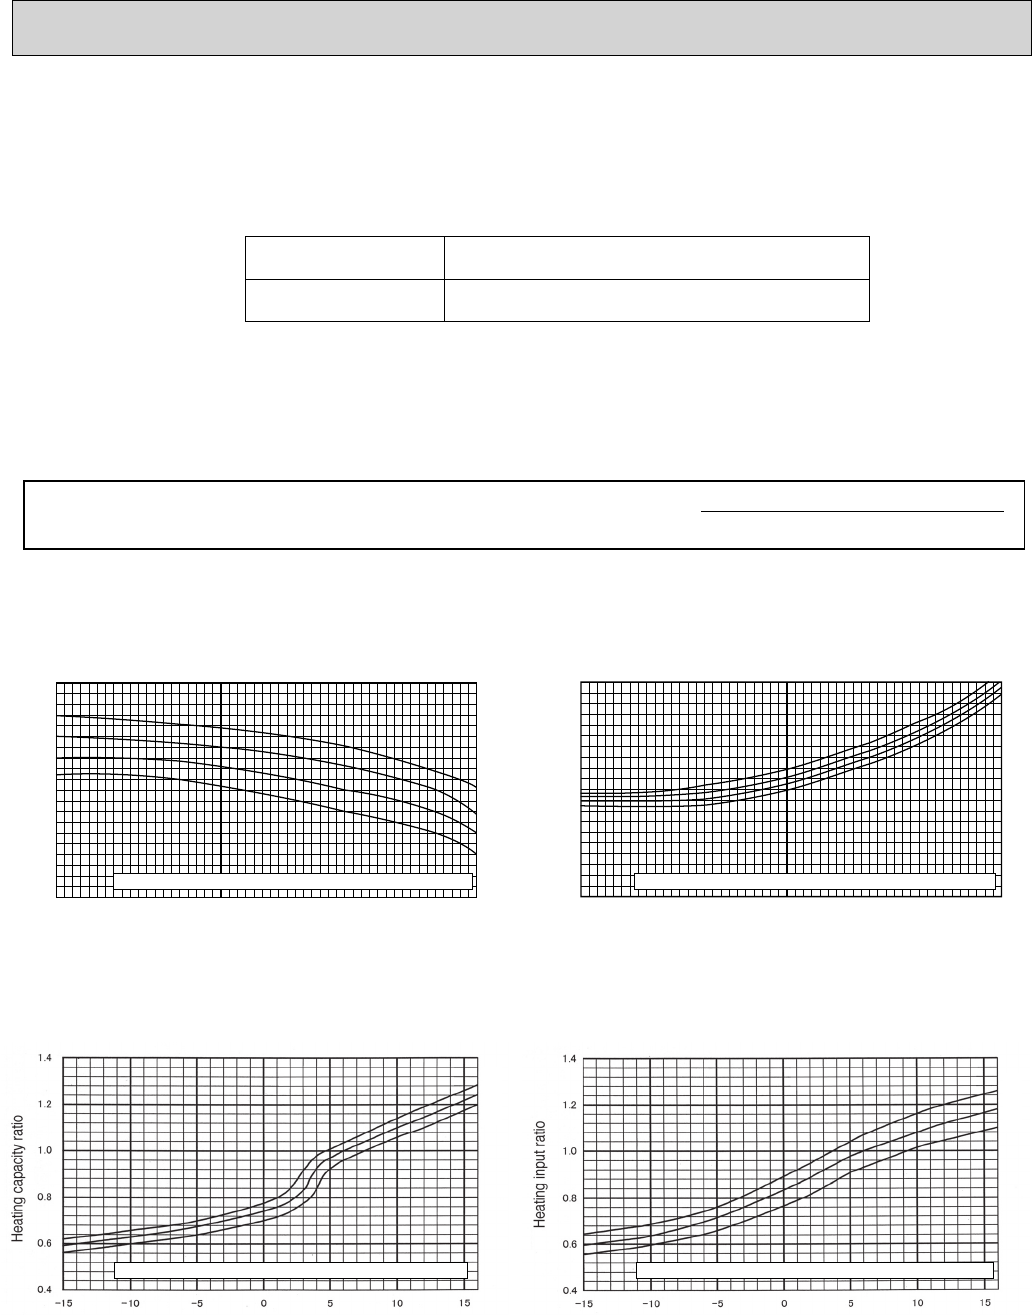
4-2. CORRECTING COOLING AND HEATING CAPACITY
4-2-1. Correcting Changes in Air Conditions
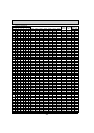
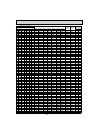
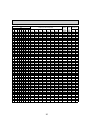
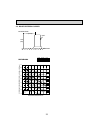
(1)The performance curve charts (Figure 1-1, 1-2, 2-1, 2-2) show the change ratio of capacity and input (power consumption)
according to the indoor and outdoor temperature condition when define the rated capacity (total capacity) and rated input
under the standard condition in standard piping length (5m) as “1.0”.
• Standard conditions:
• Use the rated capacity and rated power values given in the characteristics table for each indoor unit.
• The capacity is the single value on the side of the outdoor unit;
The capacity on the sides of each indoor unit must be added to obtain the total capacity.
(2)The capacity of each indoor unit may be obtained by multiplying the total capacity obtained in (1) by the ratio between the
individual capacity at the rated time and the total capacity at the rated time.
Individual capacity at the rated time
Individual capacity under stated conditions =Total capacity under the stated conditions o
Total capacity at the rated time
Rated cooling capacity
Rated heating capacity
Indoor D.B. 80°F / W.B. 67°F
Outdoor D.B. 95°F
Indoor D.B. 70°F
Outdoor D.B. 47°F / W.B. 43°F
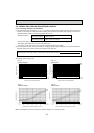
Fig. 1-1
Cooling capacity
Fig. 1-2
Cooling input
–5 0 5 10 15 20 25 30 35 40 46 (°C W.B.)
16(60.8)
18(64.4)
20(68)
22(71.6)
0.6
0.8
1
1.2
1.4
Cooling capacity ratio
Outdoor intake air dry-bulb temperature
25 32 41 50 59 68 77 86 95 104 115 (°F W.B.)
0 5 10 15 20 25 30 35 40
16(60.8)
18(64.4)
20(68)
22(71.6)
0.4
0.6
0.8
1.0
1.2
25 32 41 50 59 68 77 86 95 104 115 (°F W.B.)
–5 46 (°C W.B.)
Cooling input ratio
Outdoor intake air dry-bulb temperature
Indoor intake air wet-bulb temperature <:W.B. (°F W.B.)>
Indoor intake air wet-bulb temperature <:W.B. (°F W.B.)>
Fig. 2-1
Heating capacity
Fig. 2-2
Heating input
25(77)
20(70)
15(59)
(°C W.B.)
5 14 23 32 41 50 59 (°F W.B.)
15(59)
20(70)
25(77)
(°C W.B.)
5 14 23 32 41 50 59 (°F W.B.)
Outdoor intake air wet-bulb temperature <:W.B.> Outdoor intake air wet-bulb temperature <:W.B.>
Indoor intake air dry-bulb temperature <:D.B.(°F W.B.)>Indoor intake air dry-bulb temperature <:D.B.(°F W.B.)>
Note : These diagrams show the case where the operation frequency of a compressor is fixed.
(3) Capacity correction factor curve