


Supply Air Temperature — In systems using draw-thru air
handling units and high induction Carrier Moduline termi-
nal units, the acceptable range of supply air temperatures at
the terminals is from 50 to 54 F. The cooling coil ADP (Ap-
paratus Dew Point) will be from 3 to 5° F lower than the
supply air temperature, due to allowance for coil bypass, fan
heat and duct gain.
The system installed cost for ductwork, central air han-
dler, and VAV terminals will be greater if the air quantity is
higher because of the designer’s choice of a higher supply
air temperature. The increased fan air quantity will result in
higher fan operating cost, which may be offset by the lower
cost of operating the refrigeration system at a higher suction
temperature. The higher coil surface temperature (ADP) of
the system will result in a higher building humidity, which
will be less comfortable and require greater ventilation air.
An unduly low choice of supply air temperature may
result in unacceptably low room air motion in interior zones
with low lighting levels, and in unnecessarily low
humidity.
The same supply air temperature must be used for the zone
load and block load estimates.
Load Calculating Methods — The cooling load estimates can
be made very accurately and quickly using the Carrier E20-II
Block Load program.
Because of the computer’s speed, it is not necessary to
compromise the design procedure to obtain the most accu-
rate result. The optimum design procedure listed here as-
sumes the use of the E20-II program, and may require ‘‘short
cuts’’ when using manual methods.
While the E-20 program is the most convenient and rapid
method of load calculation, other methods will also provide
the required results. In particular, Carrier multi-room load
estimating form E-5056 is available for this purpose.
DESIGN PROCEDURE (with example)
Data Collection — Our example uses Cincinnati, Ohio as a
representative city. The building is a one-story office build-
ing with 11,250 sq ft. The building layout is shown in
Fig. 4 on page 3.
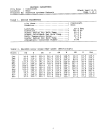
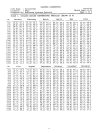
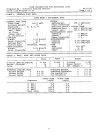
1. Using the E20-II Block Load Program, select Cincinnati
for its weather data. The WEATHER PARAMETERS print-
out shown on pages 5 and 6 shows the weather data used
for the load estimating calculations.
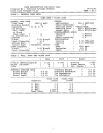
2. The next step is to gather data on the building, including
dimensions, construction materials used, internal load pat-
terns (such as lighting levels) and the building orienta-
tion. For our example, we have divided the building into
nine zones. The actual building has ten zones on its north
exposure, but we’ve grouped them all into a single zone
because zones on the same exposure tend to have similar
load patterns. Similarly, the ten south exposure zones have
been grouped into a single zone, and the four east and
west zones have been combined into single east and west
zones respectively.
Pages 7-15 contain the ZONE DESCRIPTION printouts
for each of the nine zones.
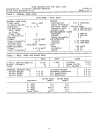
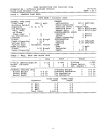
3. The final input step is to select an initial set of system
design data, including the cooling and heating set points,
the supply air temperature (or supply airflow rate, if that
is known) and the fan static pressure. This system design
data will, of course, be directly influenced by the actual
central station equipment, be it packaged or applied.
Page 16 shows the HVAC SYSTEM DATA printout which
lists the system design data we’ve selected for this
example.
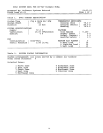
Load Calculations — With the input data from Step 1, the
Block Load Program calculates the building loads for each
month of the year to find the largest load on the building’s
air conditioning system. Typically, this will occur during the
middle or late afternoon hours in July or August. The
SYSTEM SIZING SUMMARY printout shown on pages 17
and 18 provides both the cooling and heating equipment siz-
ing data. At the same time, it provides the maximum cooling
load, maximum heating load and design airflow rate for each
zone in the building. Notice that each zone may peak at a
month and hour different from that at which the HVAC sys-
tem peaks. The detailed system load report is shown on
page 19.
4