


51 65-0303—05
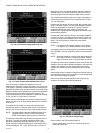
• Setpoint (for corresponding demand source)
• Burner firing rate
• Hysteresis on (for corresponding demand source)
• Hysteresis off (for corresponding demand source)
The Clear button is disabled for the PID analysis (doesn’t apply to
hysteresis).
The default sample rate is 15 sec periods (a tick mark on the X axis
for every 15 second period, with minutes displayed every 4 tick
marks).
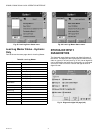
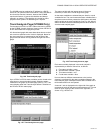
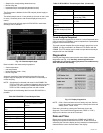
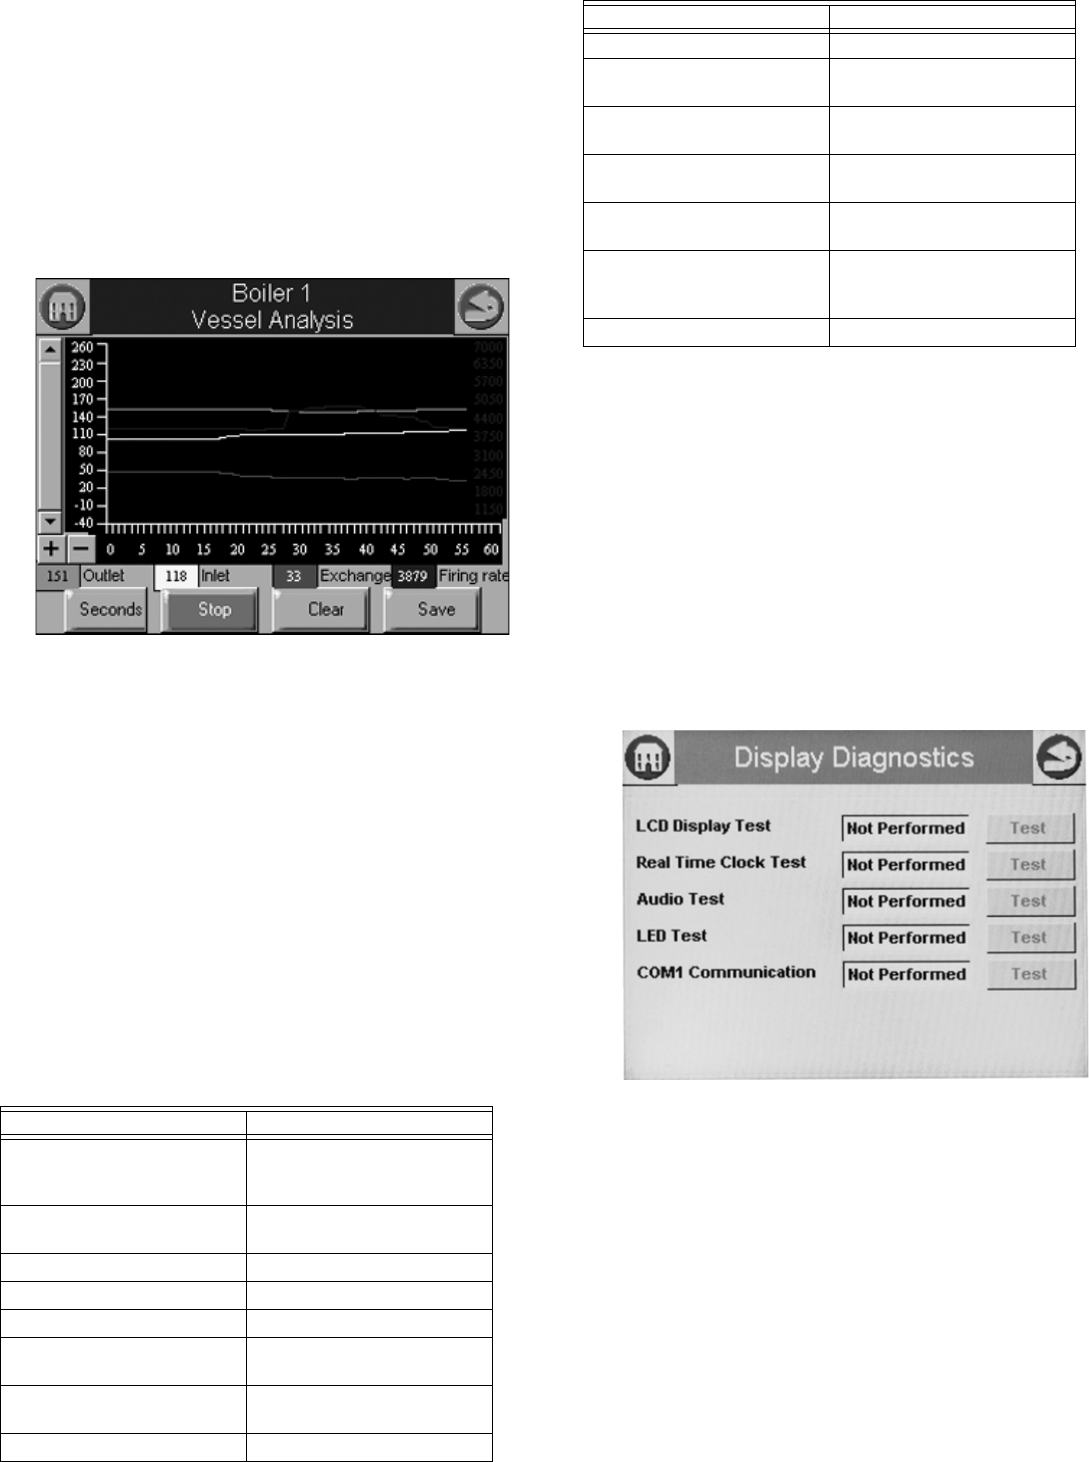
Special case trend analysis graph for R7910/R7911 vessel heat
exchange can be selected.
Fig. 112. Vessel analysis page.
Data included in the vessel analysis graph are:
• Outlet temperature
• Inlet temperature
• Heat exchange (outlet – inlet)
• Burner firing rate
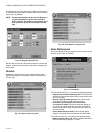
Automatic sampling of trend data takes place when the trend
analysis report is displayed. No user intervention is necessary to
invoke sampling.
NOTE: Sample data is collected and stored in the S7999B. The
R7910 or R7911 don’t collect any historical data for trending
purposes. For this reason any S7999B reset causes all
R7910 or R7911 sampling to start over with no data.
Trend analysis of the following data from each R7910/R7911 is
possible:
Trend Analysis Snapshot
The trend analysis snapshot file is stored in Comma Separated Value
(CSV) format in the S7999B so it can be imported into a spreadsheet
program such as Microsoft Excel.
The trend analysis snapshot file can be viewed in graph form on the
S7999B. It is also accessible in an Ethernet FTP session with the
S7999B. This FTP session can be used to export the trend analysis
snapshot file from the S7999B.
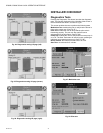
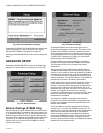
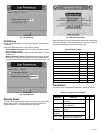
Diagnostics
Pressing the Diagnostics button permits some display hardware
diagnostics (see Fig. 104). Normally, these diagnostics are
applicable only for factory testing purposes, but conditions may
arise that warrant this testing.
Fig. 113. Display diagnostics.
NOTE: COM 1 Communication test is a factory-only test. Perform-
ing this text when not connected to a factory test fixture will
always yield a “Failed” result.
Each test is invoked by pressing the Test button next to the
diagnostic. The results of the diagnostic test (“PASS” or “FAIL”)
display in the text box next to the Test button.
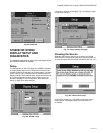
Date and Time
Display time can be configured in the S7999B and S7999C OI
Displays and applied to the R7910A or R7911. A date and time is
entered by the user at the display and any data that is timestamped is
marked with the current time and date in the display.
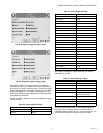
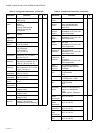
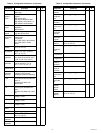
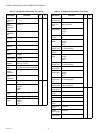
Table 59. R7910/R7911 Trend Analysis Data.
Data Comment
Demand source CH, DHW, LL (Lead Lag), or
FP (Frost Protection) Steam
Sensor
Outlet temperature (R7910
only)
Firing rate % or RPM
Fan speed PWM feedback
Flame signal strength V
Inlet temperature (R7910
only)
If enabled
DHW temperature (R7910
only)
If enabled
Outdoor temperature If enabled
Stack temperature If enabled
Header temperature (R7910
only)
If enabled
CH setpoint Actual CH setpoint based on
time of day (TOD).
DHW setpoint (R7910 only) Actual DHW setpoint based
on TOD.
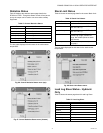
Central Heat Operation
Analysis
Domestic Hot Water
Operation Analysis (R7910
only)
Vessel Analysis
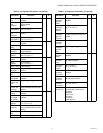
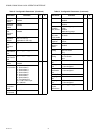
Table 59. R7910/R7911 Trend Analysis Data. (Continued)
Data Comment