


C-95
Cisco Intrusion Prevention System Sensor CLI Configuration Guide for IPS 7.2
OL-29168-01
Appendix C Troubleshooting
Gathering Information
Note
You must have health monitoring enabled to support the historic interface function.
Each record has the following details:
•
Total packets received
•
Total bytes received
•
FIFO overruns
•
Receive errors
•
Received Mbps
•
Missed packet percentage
•
Average load
•
Peak load
Note
Historical data for each interface for the past 72 hours is also included in the show tech-support
command.
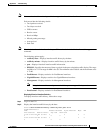
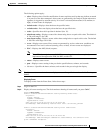
The following options apply:
•
traffic-by-hour—Displays interface traffic history by the hour.
•
traffic-by-minute—Displays interface traffic history by the minute.
•
past—Displays historical interface traffic information.
•
HH:MM—Specifies the amount of time to go back in the past to begin the traffic display. The range
for HH is 0 to 72. The range for MM is 0 to 59. The minimum value is 00:01 and the maximum value
is 72:00.
•
FastEthernet—Displays statistics for FastEthernet interfaces.
•
GigabitEthernet—Displays statistics for GigabitEthernet interfaces.
•
Management—Displays statistics for Management interfaces.
Note
Only platforms with external ports marked Management support this keyword.
•
PortChannel—Displays statistics for PortChannel interfaces.
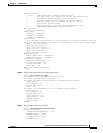
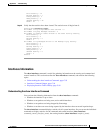
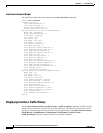
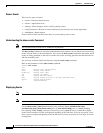
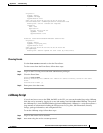
Displaying Historical Interface Statistics
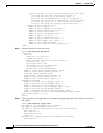
To display interface traffic history, follow these steps:
Step 1
Log in to the CLI.
Step 2
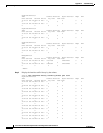
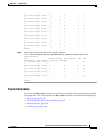
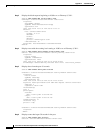
Display the interface traffic history by the hour.
sensor# show interfaces-history traffic-by-hour past 02:15
GigabitEthernet0/0
Time Packets Received Bytes Received Mbps MPP
FIFO Overruns Receive Errors Avg Load Peak Load
11:30:31 UTC Tue Mar 05 2013 0 0 0 0
0 0 0 0
10:27:32 UTC Tue Mar 05 2013 0 0 0 0
0 0 0 0