


26 GETTING STARTED WITH THE CBR 2™ SONIC MOTION DETECTOR © 1997, 2004, 2006 TEXAS INSTRUMENTS INCORPORATED
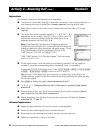
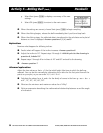
Activity 4—Bouncing Ball
(cont.)
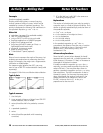
Parabolic
Explorations
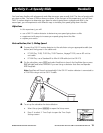
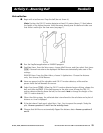
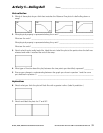
The Distance-Time plot of the bounce forms a parabola.
Ê The plot is in Trace mode. Press ~ to determine the vertex of the first good bounce—a
nice shape without lots of extra noise. Answer question 5 on the activity sheet.
Ë Select Main to return to the main screen. Choose Quit, and then select OK to quit
EasyData.
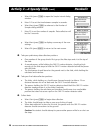
Ì The vertex form of the quadratic equation, Y = A(X – H)
2
+ K, is
appropriate for this analysis. Press
œ. In the Y= editor, turn off
any functions that are selected. Enter the vertex form of the
quadratic equation: Yn=A…(X–H)^2+K.
Note: If you have the Transformation Graphing application
installed on your calculator, this is accomplished much easier by
changing coefficient values directly on the graph screen. (There
is no Transformation Graphing application for the TI-89,
TI-89 Titanium, TI-92 Plus, or Voyageé 200.)
TI-89, TI-89 Titanium, TI-92 Plus and Voyageé 200 users enter
yn(x) = a* (x+h)^2 + k.
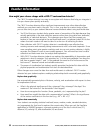
TI83/84 Family
TI89/Titanium/92+/V200
Í On the Home screen, store the value you recorded in question 5 for the height in
variable K; store the corresponding time in variable H; store 1 in variable A.
For example (TI-83 & TI-84 Family users): Press 4 v t K Í, 2.5 v t
H Í, 1 v t A Í to set K=4, H=2.5, and A=1.
Tip (all users): At the beginning, you may want to increase the y max value of the
window settings in order to see the function being drawn and keep the collected data
on the same graph.
Î Press to display the graph. Answer questions 6 and 7.
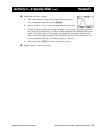
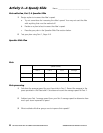
Ï Try A = 2, 0, –1. Complete the first part of the chart in question 8 and answer
question 9.
Ð Choose values of your own for A until you have a good match for the plot. Record
your choices for A in the chart in question 8.
Ñ Repeat the activity, but this time choose the last (right-most) full bounce. Answer
questions 10, 11, and 12.
Advanced explorations
Ê Repeat the data collection, but do not choose a single parabola.
Ë Record the time and height for each successive bounce.
Ì Determine the ratio between the heights for each successive bounce.
Í Explain the significance, if any, of this ratio.