


24 GETTING STARTED WITH THE CBR 2™ SONIC MOTION DETECTOR © 2004 TEXAS INSTRUMENTS INCORPORATED
Activity 4—Bouncing Ball Notes for Teachers
Concepts
Function explored: parabolic
Real-world concepts such as free-falling and bouncing
objects, gravity, and constant acceleration are
examples of parabolic functions. This activity
investigates the values of height, time, and the
coefficient A in the quadratic equation,
Y = A(X – H)
2
+ K, which describes the behavior of a
bouncing ball.
Materials
Ÿ calculator (see page 2 for available models)
Ÿ CBR 2™ motion detector
Ÿ unit-to-CBR 2™ or I/O unit-to-unit cable
Ÿ EasyData application or RANGER program
Ÿ large (9-inch) playground ball
Ÿ TI ViewScreené panel (optional)
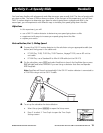
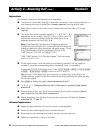
Hints
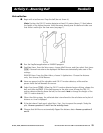
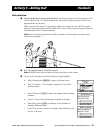
This activity is best performed with two students, one
to hold the ball and the other to select
Start on the
calculator.
See pages 6–9 for hints on effective data collection.
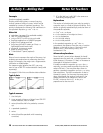
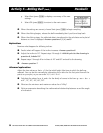
The plot should look like a bouncing ball. If it does
not, repeat the sample, ensuring that the
CBR 2™
motion detector is aimed squarely at the ball. A large
ball is recommended.
Typical plot
TI-83/84 Family TI-89/Titanium/92+/V200
Explorations
After an object is released, it is acted upon only by
gravity (neglecting air resistance). So A depends on
the acceleration due to gravity, N9.8 metersàsecond
2
(N32 feetàsecond
2
). The negative sign indicates that
the acceleration is downward.
The value for A is approximately one-half the
acceleration due to gravity, or N4.9 metersàsecond
2
(N16 feetàsecond
2
).
Typical answers
1. time (from start of sample); seconds; height à
distance of the ball above the floor; meters or feet
2. initial height of the ball above the floor (the peaks
represent the maximum height of each bounce);
the floor is represented by y = 0.
3. The Distance-Time plot for this activity does not
represent the distance from the
CBR 2™ motion
detector to the ball.
Ball Bounce flips the distance
data so the plot better matches students’
perceptions of the ball’s behavior. y = 0 on the
plot is actually the point at which the ball is
farthest from the
CBR 2™ motion detector, when
the ball hits the floor.
4. Students should realize that the x-axis represents
time, not horizontal distance.
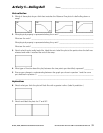
7. The graph for A = 1 is both inverted and broader
than the plot.
8. A < L1
9. parabola concave up; concave down; linear
12. same; mathematically, the coefficient A represents
the extent of curvature of the parabola; physically,
A depends upon the acceleration due to gravity,
which remains constant through all the bounces.
Advanced explorations
The rebound height of the ball (maximum height for a
given bounce) is approximated by:
y = hp
x
, where
0 y is the rebound height
0 h is the height from which the ball is released
0 p is a constant that depends on physical
characteristics of the ball and the floor surface
0 x is the bounce number
For a given ball and initial height, the rebound height
decreases exponentially for each successive bounce.
When x = 0, y = h, so the y-intercept represents the
initial release height.
Ambitious students can find the coefficients in this
equation using the collected data. Repeat the activity
for different initial heights or with a different ball or
floor surface.
After manually fitting the curve, students can use
regression analysis to find the function that best
models the data. Follow the calculator operating
procedures to perform a quadratic regression on lists
L1 and L2.
Extensions
Integrate under Velocity-Time plot, giving the
displacement (net distance traveled) for any chosen
time interval. Note the displacement is zero for any
full bounce (ball starts and finishes on floor).