


12 GETTING STARTED WITH THE CBR 2™ SONIC MOTION DETECTOR © 2000 VERNIER SOFTWARE & TECHNOLOGY
Activity 1—Graphing Your Motion
(cont.)
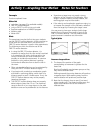
Linear
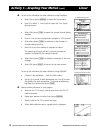
Î To set up the calculator for data collection using EasyData:
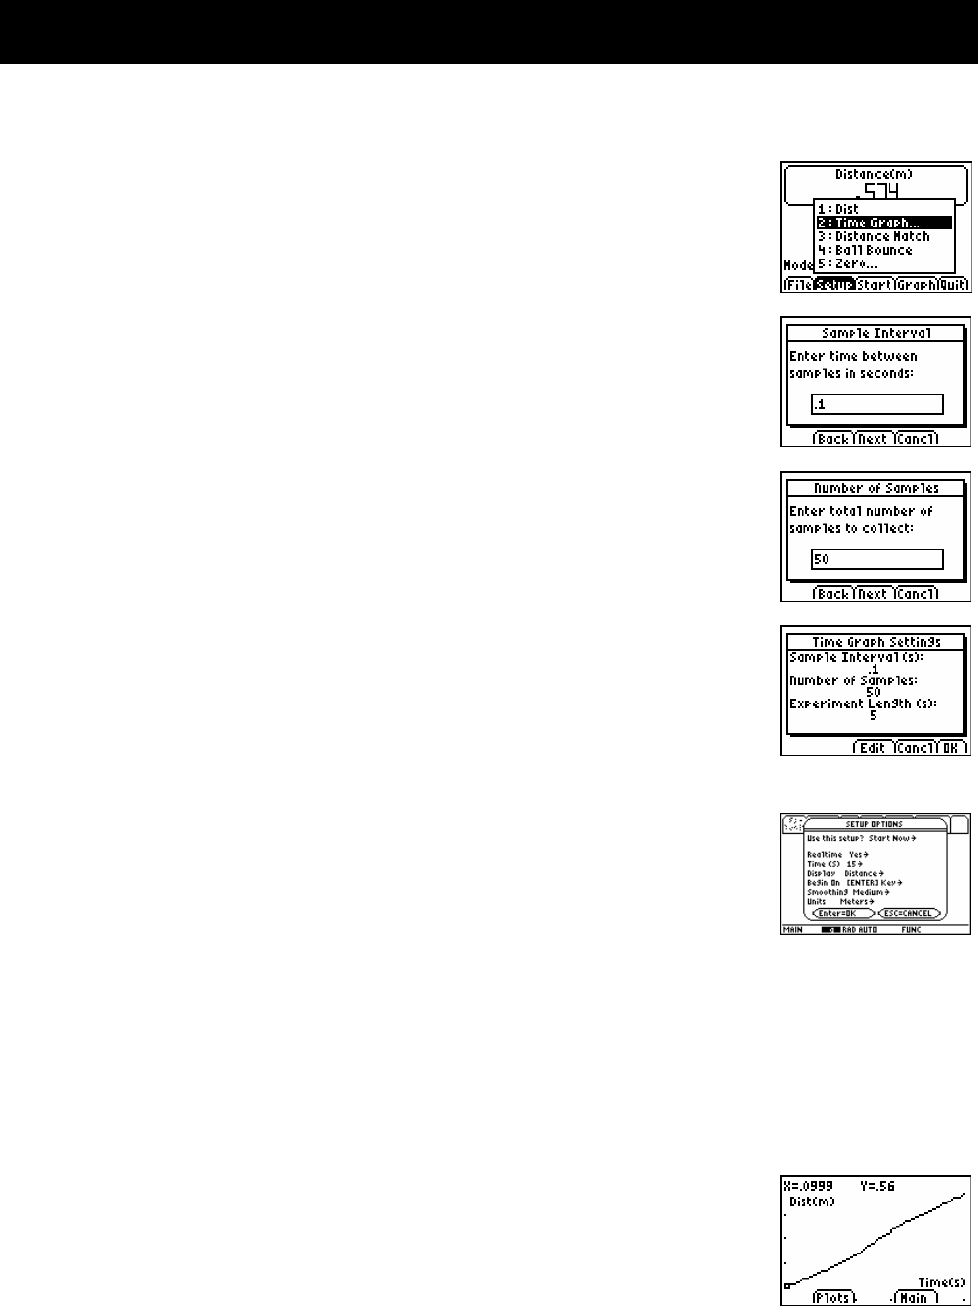
TI-83/84 Family users
a. Select Setup (press p) to open the Setup menu.
b. Press 2 to select
2: Time Graph to open the Time Graph
Settings
screen.
c. Select Edit (press q) to open the
Sample Interval dialog
window.
d. Enter 0.1 to set the time between samples to 1/10 second.
e. Select
Next (press q) to advance to the Number of
Samples
dialog window.
f. Enter 50 to set the number of samples to collect.
The experiment length will be 5 seconds (number of
samples multiplied by the sample interval).
g. Select
Next (press q) to display a summary of the new
settings.
h. Select
OK (press s) to return to the main screen.
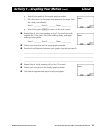
To set up the calculator for data collection using RANGER:
a. Choose 1:Setup/Sample… from the Main Menu.
b. Use C D to move to each parameter line. Use B to view
the options for each parameter. To change a parameter,
highlight the options and press ¸.
TI-89/Titanium/92+/V200
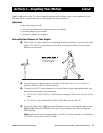
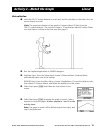
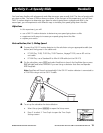
Ï Explore making distance vs. time graphs.
a. Stand at the 1.0-m mark, facing away from the
CBR 2™
motion detector.
b. Signal your partner to select
Start (press p).
c. Slowly walk to the 2.5-m mark and stop.
d. When data collection ends, a graph plot is displayed.