


14 GETTING STARTED WITH THE CBR 2™ SONIC MOTION DETECTOR © 2004 TEXAS INSTRUMENTS INCORPORATED
Activity 2—Match the Graph Notes for Teachers
Concepts
Function explored: linear
Distance Match introduces the real-world concepts of
distance and time—or more precisely, the concept of
distance versus time.
In Explorations, students are asked to convert their
rate of walking in meters per second to kilometers per
hours.
Once they have mastered the Distance-Time match,
challenge your students to a Velocity-Time match.
Materials
Ÿ calculator (see page 2 for available models)
Ÿ CBR 2™ motion detector
Ÿ unit-to-CBR 2™ or I/O unit-to-unit cable
Ÿ EasyData application or RANGER program
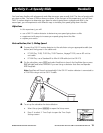
A TI ViewScreené panel allows other students to
watch—and provides much of the fun of this activity.
Hints
Students really enjoy this activity. Plan adequate time
because everybody will want to try it!
This activity works best when the student who is
walking (and the entire class) can view his or her
motion projected on a wall or screen using the TI
ViewScreené panel.
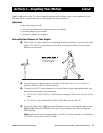
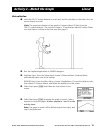
Guide the students to walk in-line with the CBR 2™
motion detector; they sometimes try to walk sideways
(perpendicular to the line to the CBR 2™ motion
detector) or even to jump up!
Instructions suggest that the activity be done in
meters, which matches the questions on the student
activity sheet.
See pages 6–9 for hints on effective data collection.
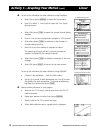
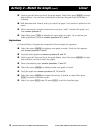
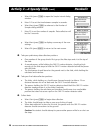
Typical plot
Distance vs. Time
Matching Distance vs. Time
Typical answers
1. time (from start of sample); seconds; 1 second;
distance (from the CBR 2™ motion detector to the
object); meters; 1 meter
2. the y-intercept represents the starting distance
3. varies by student
4. backward (increase the distance between the
CBR 2™ motion detector and the object)
5. forward (decrease the distance between the
CBR 2™ motion detector and the object)
6. stand still; zero slope requires no change in y
(distance)
7. varies by graph; @yà3.3
8. varies by graph; @yà1
9. the segment with the greatest slope (positive or
negative)
10. this is a trick question—the flat segment, because
you don’t move at all!
11. walking speed; when to change direction and/or
speed
12. speed (or velocity)
13. varies by graph (example: 1.5 meters in 3 seconds)
14. varies by graph; example: 0.5 metersà1 second
example: (0.5 meters à 1 second) Q (60 seconds à
1 minute) = 30 meters à minute
example: (30 meters à 1 minute) Q (60 minutes à 1
hour) = 1800 meters à hour
example: (1800 meters à 1 hour) Q (1 kilometer à
1000 meters) = 1.8 kilometers à hour.
Have students compare this last number to the
velocity of a vehicle, say 96 kilometers à hour
(60 miles per hour).
15. varies by graph; sum of the @y for each line
segment.