


10 GETTING STARTED WITH THE CBR 2™ SONIC MOTION DETECTOR © 2000 VERNIER SOFTWARE & TECHNOLOGY
Activity 1—Graphing Your Motion Notes for Teachers
Concepts
Function explored: linear
Materials
Ÿ calculator (see page 2 for available models)
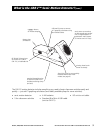
Ÿ CBR 2™ motion detector
Ÿ unit-to-CBR 2™ or I/O unit-to-unit cable
Ÿ EasyData application or RANGER program
Ÿ Masking tape
Ÿ Meter stick
Hints
This experiment may be the first time your students
use the CBR 2™ motion detector. A little coaching on
its use now will save time later in the year as the
CBR 2™ motion detector is used in many experiments.
The following are hints for effective use of the
CBR 2™ motion detector:
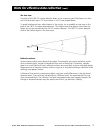
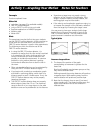
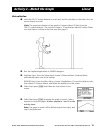
0 In using the CBR 2™ motion detector, it is
important to realize that the ultra sound is emitted
in a cone about 30° wide. Anything within the
cone of ultrasound can cause a reflection and
possibly an accidental measurement. A common
problem in using motion detectors is getting
unintentional reflections from a desk or chair in
the room.
0 Often unintended reflections can be minimized by
tilting the CBR 2™ motion detector slightly.
0 If you begin with a velocity or acceleration graph
and obtain a confusing display, switch back to a
distance graph to see if it makes sense. If not, the
CBR 2™ motion detector may not be properly
targeting the target.
0 The CBR 2™ motion detector does not properly
detect objects closer than 15 cm. The maximum
range is about 6 m, but stray objects in the wide
detection cone can be problematic at this distance.
0 Sometimes a target may not supply a strong
reflection of the ultrasound. For example, if the
target is a person wearing a bulky sweater, the
resulting graph may be inconsistent.
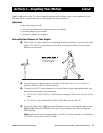
0 If the velocity and acceleration graphs are noisy, try
to increase the strength of the ultrasonic reflection
from the target by increasing the target’s area.
You may want to have your students hold a large
book in front of them as they walk in front of the
CBR 2™ motion detector. This will produce better
graphs because it smoothes out the motion.
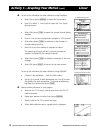
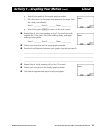
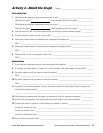
Typical plots
Distance vs. Time
Matching Distance vs. Time
Answers to questions
9. The slope of the portion of the graph
corresponding to movement is greater for the
faster trial.
Results will probably vary between groups as they
may walk at different rates.
Walking towards the motion detector will produce
a negative slope. While walking away from the
motion detector will produce a positive slope.
12. Note that the slope is close to zero (if not zero)
when standing still. The slope should be zero, but
expect small variation due to the variation in
collected data.