


86 Chapter 3 Configuring and graphing ports
214393-A
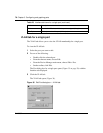
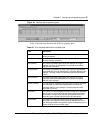
Graphing port statistics
You can graph statistics for either a single port or multiple ports from the
graphPort dialog box. The windows displayed are identical for either single or
multiple port configuration.
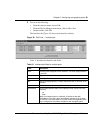
To open the graphPort dialog box for graphing:
1 Select the port or ports you want to graph.
To select multiple ports, [Ctrl] + left-click the ports that you want to
configure. A yellow outline appears around the selected ports.
2 Do one of the following:
• From the Device Manager main menu, choose Graph > Port.
• From the shortcut menu, choose Graph.
• On the toolbar, click Graph.
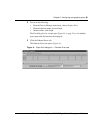
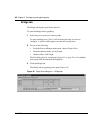
The graphPort dialog box for a single port (Figure 40 on page 87) or for
multiple ports opens with the Interface tab displayed.
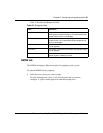
Interface tab for graphing ports
The Interface tab shows interface parameters for graphing a port or ports.
To open the Interface tab for graphing:
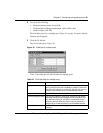
1 Select the port or ports you want to graph.
To select multiple ports, [Ctrl] + left-click the ports that you want to
configure. A yellow outline appears around the selected ports.
2 Do one of the following:
• From the Device Manager main menu, choose Graph > Port.
• From the shortcut menu, choose Graph.
• On the toolbar, click Graph.
The Port dialog box for a single port (Figure 40 on page 87) or for multiple
ports opens with the Interface tab displayed.