


34 Chapter 1 Device Manager basics
214393-A
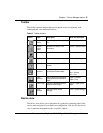
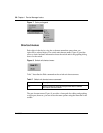
Types of statistics
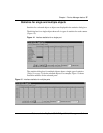
The data tables in the statistics dialog boxes list the counters, or categories of
statistics being gathered, for the specified object. For example, the categories for
ports include Interface, Ethernet Errors, Bridge, and Rmon. Each category can be
associated with six types of statistics. Table 10 describes the types of statistics that
are available.
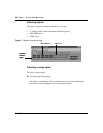
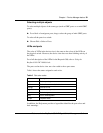
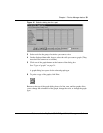
Types of graphs
With Device Manager, you can create line, area, bar, and pie graphs. Figure 10,
Figure 11, Figure 12, and Figure 13 illustrate the different graph styles,
respectively.
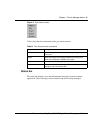
Table 10 Types of statistics
Statistic Description
AbsoluteValue The total count since the last time counters were reset. A system
reboot resets all counters.
Cumulative The total count since the statistics window was first opened. The
elapsed time for the cumulative counter is displayed at the bottom of
the graph window.
Average The cumulative count divided by the cumulative elapsed time.
Minimum The minimum average for the counter for a given polling interval over
the cumulative elapsed time.
Maximum The maximum average for the counter for a given polling interval over
the cumulative elapsed time.
LastValue The average for the counter over the last polling interval.