


38 Chapter 1 Device Manager basics
214393-A
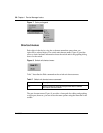
To change the type of statistics displayed, select a different type from the show list
at the bottom of the dialog box.
The statistics are updated based on the poll interval shown at the bottom of the
dialog box. You can select a different polling interval.
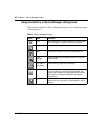
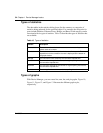
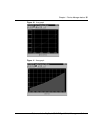
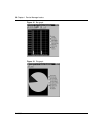
Buttons for bar, pie, and line graphs are located at the bottom of a statistics dialog
box.
See the next section, “Viewing statistics as graphs,” for instructions to use these
buttons.
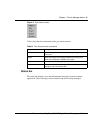
You can export the statistics to a tab-separated file format and import the file into
other applications. To export the information, use the Export Data button below
the table.
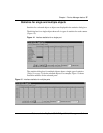
Viewing statistics as graphs
To create a graph for an object:
1 Select the object or objects to be graphed.
See “Selecting objects” on page 28.
2 Do one of the following:
• On the toolbar, click Graph Selected.
• From the shortcut menu for the object, choose Graph.
• From the main menu, choose Graph > Chassis or Graph > Port.
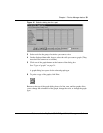
A statistics dialog box opens with tabs for different categories of statistics for
the selected object (Figure 16).