


Chapter 1 Device Manager basics 39
Reference for the BayStack 380-24F Gigabit Switch Management Software
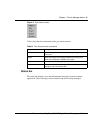
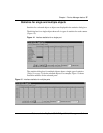
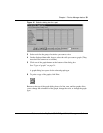
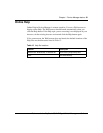
Figure 16 Statistics dialog box for a port
3 Select a tab for the group of statistics you want to view.
4 On the displayed data table, drag to select the cells you want to graph. (They
must be in the same row or column.)
5 Click one of the graph buttons at the bottom of the dialog box
See “Types of graphs” on page 34.
A graph dialog box opens for the selected graph type.
6 To print a copy of the graph, click Print.
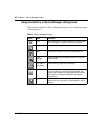
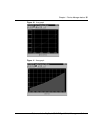
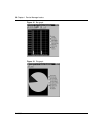
Buttons at the top of the graph dialog boxes for line, area, and bar graphs allow
you to change the orientation of the graph, change the scale, or change the graph
type.